

SAMPLE PREPARATION FOR MEASUREMENT
Measurements are made for two types of adulterants (i.e., solid and liquid). For solid adulterants of detergent and starch, concentrations in the range of 1 to 10 percent (weight/volume) of pure double-toned milk are used. One gram of adulterant is added in ten consecutive steps to 100 ml of pure double-toned milk in a thin plastic box. Measurements are taken at each step, starting from pure milk (calibrated as the standard) and continuing until the adulterant concentration reaches 10 percent.
For a liquid adulterant, water (as the adulterant) is mixed with pure milk in volumetric ratios (i.e, volume/volume). Starting with a 5/100 concentration (i.e., 5 ml of distilled water in 100 ml of pure milk) and ending with a 100/100 concentration (i.e., 100 ml of distilled water in 100 ml of pure milk), twenty consecutive measurements are taken at equal intervals.
The above measurements are performed on relatively large concentrations of adulterants considered to be macro-level concentrations. Measurements are also performed using very small (micro-level) concentrations of detergent in pure double-toned milk, from 0.01 to 0.1 percent. The results show that the detection of micro-quantities of adulterants in liquid food items is also possible.
The measurement setup for macro- and micro-level measurements is the same. The cross-sectional dimensions of the flat box are unchanged at 25 by 16 cm2. The only difference is the depth of the sample liquid. For macro-level measurements, the depth of the liquid is 0.25 cm, creating a total volume of 100 ml. For micro-level measurements, the depth of the liquid is 1 cm, creating a total volume of 400 ml. Impurities in milk can, therefore, be determined in macro as well as micro concentrations using the same technique. The measured results, in each case, show similar trends.
RESULTS AND ANALYSIS
Measurements of starch dissolved in milk are shown in Figure 3. Measured |S21| for increasing concentrations of starch as the adulterant in pure double-toned milk measured from 9 to 12 GHz is shown in Figure 3a, where |S21| of pure double-toned milk is used as the reference. |S21| decreases monotonically with a 1 to 5 percentage point increase in the concentration of starch. The portion of the curve, from 10.2 to 10.8 GHz, is selected to more clearly illustrate the trend (see Figure 3b).
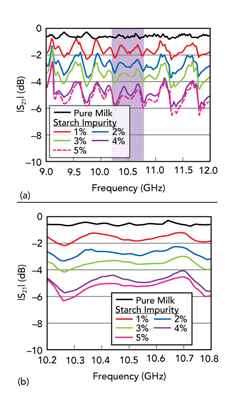
Figure 3 Measured |S21| from 9 to 12 GHz (a), and the same measurement shown from 10.2 to 10.8 GHz (b).
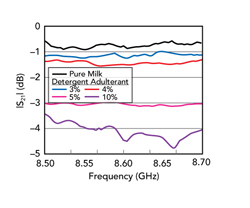
Figure 4 Measured |S21| for increasing concentrations of detergent.
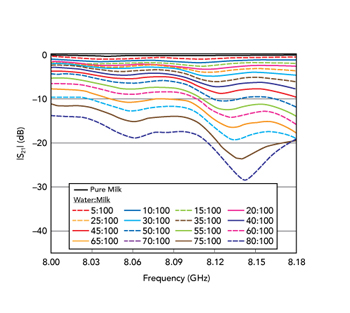
Figure 5 Measured |S21| for increasing concentrations of water.
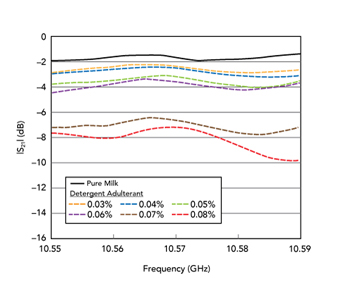
Figure 6 Measured |S21| for increasing micro-level concentrations of detergent.
The effect on |S21| of increasing concentrations of detergent is plotted in Figure 4, while that of water as a liquid adulterant is shown in Figure 5. In both cases, the trend is similar; |S21| decreases with an increasing percentage of adulterant.
|S21| for micro levels of detergent as an adulterant in pure double-toned milk is plotted in Figure 6. The percentage of detergent adulterant varies from 0.03 to 0.08 percent in steps of 0.01 percent. This shows that very low levels of impurities in milk can be detected with this technique as well.
DISCUSSION
By measuring the transmission of microwave radiation through small quantities of adulterated milk, the concentration of its adulterants can be measured. When starch, detergent or water is added to milk, its dielectric constant increases monotonically with the increasing percentage of adulterant.18,19 As the relative permittivity increases, in turn, |S21| decreases.17
The process can be extended to detect adulterants in other liquid food products like juices, beverages, drinks and edible oils. Even contaminants present in very small amounts in drinking water can be detected, as measurements in distilled water confirm. Various harmful chemicals, industrial waste and agricultural byproducts, such as heavy metals, fertilizer and pesticide residues, can contaminate water. These kinds of impurities are often present in small concentrations and pose serious health complications in drinking water or water used for other purposes.
The approach described here can be of enormous help in detection. It is relatively simple and less time-consuming than other methods. Concentrations of impurities can be measured based on a simple graphical technique without the need for expert food analysis.
CONCLUSION
This process has a crucial industrial application. In the processing and packaging of food products in mass quantities, prior knowledge of the nature of their microwave transmission characteristics can be an indication of their purity/quality.
The quality of liquid food products can be checked with this method before commercial sale. This investigation has shown that it is possible to identify detergent, for example, in pure double-toned milk in proportions as low as 0.03 percent by weight of fresh milk. Modifications to the measurement setup can be made for greater accuracy and precision. It may also be possible to perform non-intrusive detection without opening the food package.
This process can be extended beyond food articles, for example, it may be useful for the detection of the percentage of components or impurities in crude oil or the detection of foreign elements in blood and other body fluids by medical diagnostic laboratories.
References
- S. Bansal, A. Singh, M. Mangal, K. A. Mangal and S. Kumar, “Food Adulteration: Sources, Health Risks and Detection Methods,” Critical Reviews in Food Science and Nutrition, Vol. 57, No. 6, April 2017, pp. 1174-1189.
- S. Nirwal, R. Pant and N. Rai, “Analysis of Milk Quality, Adulteration and Mastitis in Milk Samples Collected from Different Regions of Dehradun,” International Journal of PharmTech Research, Vol. 5, No. 2, June 2013, pp. 359-364.
- A. Tanzina and A. Shoeb, “Common Milk Adulteration and Their Detection Techniques,” International Journal of Food Contamination, Vol. 3, No. 22, December 2016.
- B. S. Berry, C. S. Fernandes, A. Rajaratnam, S. N. DeChiara and R. C. Mace, “Measurement of the Hematocrit Using Paper-Based Microfluidic Devices,” Lab on a Chip, Vol. 16, No. 19, September 2016, pp. 3689-3694.
- C. J. Moore, J. Spink and M. Lipp, “Development and Application of a Database of Food Ingredient Fraud and Economically Motivated Adulteration from 1980 to 2010,” Journal of Food Science, Vol. 77, No. 4, April 2012, pp. 118-126.
- L. Mu, M. Dawande and V. Mookerjee, “Improving the Milk Supply Chain in Developing Countries: Analysis, Insights and Recommendations,” Production and Operations Management, Vol. 23, No. 7, July 2014, pp. 1098-1112.
- P. Singh and N. Gandhi, “Milk Preservatives and Adulterants: Processing, Regulatory and Safety Issues,” Food Reviews International, Vol. 31, No. 3, February 2015, pp. 236-261.
- D. R. Maheswara, K. Venkatesh and S. V. C. Reddy, “Adulteration of Milk and its Detection: A Review,” International Journal of Chemical Studies, Vol. 5, No. 4, 2017, pp. 613-617.
- J. F. O’Hara, R. Singh, I. Brener, E. Smirnova, J. Han, A. J. Taylor and W. Zhang, “Thin-Film Sensing with Planar Terahertz Metamaterials: Sensitivity and Limitations,” Optical Express, Vol. 16, No. 3, January 2008, pp. 1786-1795.
- W. Withayachumnankul, H. Lin, K. Serita, C. M. Shah, S. Sriram, M. Bhaskaran, M. Tonouchi, C. Fumeaux and D. Abbott, “Sub-Diffraction Thin-Film Sensing with Planar Terahertz Metamaterials,” Optics Express, Vol. 20, No. 3, January 2012, pp. 3345-3352.
- M. H. Zarifi and M. Daneshmand, “Wide Dynamic Range Microwave Planar Coupled Ring Resonator for Sensing Applications,” Applied Physics Letters, Vol. 108, No. 23, June 2016.
- A. M. Albishi and O. M. Ramahi, “Highly Sensitive Microwaves Sensors for Fluid Concentration Measurements,” IEEE Microwave and Wireless Components Letters, Vol. 28, No. 4, April 2018, pp. 287-289.
- M. H. Zarifi and M. Daneshmand, “High-Resolution RFID Liquid Sensing Using a Chipless Tag,” IEEE Microwave and Wireless Components Letters, Vol. 27, No. 3, March 2017, pp. 311-313.
- L. Iram, M. Y. Sandhu, A. K. M. Z. Hossain and S. Khan, “Portable Real-Time Microwave Milk Quality Monitoring Sensor,” Proceedings of the 9th International Conference on Computer and Communication Engineering (ICCCE), August 2023, pp. 167-172.
- A. Sadat, P. A. Mustajab and A. I. Khan, “Determining the Adulteration of Natural Milk with Synthetic Milk Using AC Conductance Measurement,” Journal of Food Engineering, Vol. 77, No. 3, December 2006, pp. 472-477.
- G. Durante, W. Becari, F. A. S. Lima and H. E. M. Peres, “Electrical Impedance Sensor for Real-Time Detection of Bovine Milk Adulteration,” IEEE Sensors Journal, Vol. 16, No. 4, January 2015, pp. 861-865.
- K. Zhang, J. Fu, L. Y. Xiao, Q. Wu and L. -W. Li, “Total Transmission and Total Reflection of Electromagnetic Waves by Anisotropic Epsilon-Near-Zero Metamaterials Embedded with Dielectric Defects,” Journal of Applied Physics, Vol. 113, No. 8, February 2013.
- D. Worku, M. Sharma, P. Kumar and B. Koteswararao, “Detection of Adulteration in Milk Using Capacitor Sensor with Especially Focusing on Electrical Properties of the Milk,” Proceedings of the 7th International Electronic Conference on Sensors and Applications, November 2020.
- Y. Smirnov, Y. Shestopalov and D. Mironov, “Analysis of Inverse Scattering in a Waveguide Using the Method of Volume Singular Integral Equation,” URSI International Symposium on Electromagnetic Theory, August 2010.