
Technical Feature
Regrowth of Data Spectral Sidelobes from AM/PM Effects and Hard Limiting
Frank Amoroso
Santa Ana, CA
A previous article1 set forth a framework for analyzing and predicting the power spectral sidelobe regrowth from soft saturating amplification of data signals having small percentage carrier ripple. The results assumed the absence of AM/PM conversion in the saturating amplifier, and the underlying analysis related to sub-saturation levels of input drive. The present article extends the previous results by including AM/PM conversion, and also shows that, under certain commonly encountered conditions, the previous results on AM/AM sidelobe regrowth are easily extended to the case of hard limiting.
Summary of Previous Results
Starting with a signal in the usual complex baseband form
s(t) = a(t)ej f(t) (1)
the amplitude factor is reexpressed as
a(t) = ao [1+d(t)] (2)
where
ao = mean amplitude
The ripple factor d(t) has a zero mean value.
The output of the soft saturating amplifier, expressed in the usual Taylor's series form for analyses of this type, is given by
r(t) = K1 s(t) + K3 [s(t)]3 + K5 [s(t)]5 + ... (3)
where even-power terms are omitted because they do not contribute to spectral sidelobe regrowth in the vicinity of the signal spectrum. With the Taylor's series truncated, as for small to moderate drive levels, to the first two terms in Equation 3, and with substitution of Equations 1 and 2 into Equation 3, the amplifier output is approximated by
r^(t) = (1 + 0.75K3 a2 o )s(t) + 1.5K3 a3 o d(t)ej f(t) (4)
where the term involving a3 o clearly represents the regrown spectral sidelobe component of the amplifier output. The time function d(t)ej f(t) is called D(t), the parasignal, and is the basis of the spectral regrowth calculation. The power spectral density of D(t) is called the paraspectrum. Quantitative examples of power spectral regrowth in terms of the paraspectrum were given previously1 for K3 = -1/6.
Extension of Previous Results to Hard Limiting
|
|
|
Fig. 1 Hard limited spectrum is the paraspectrum in sidelobe region. |
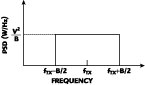
The extension of the previous results to the case of hard limiting will be carried out under the assumption that s(t) is strictly bandlimited. Once that assumption is postulated, the analysis proceeds as outlined in Figure 1 . The bandwidth of s(t) is Ws . The hard limiter produces a unit amplitude output. At the output of the hard limiter, the amplitude ripple of s(t) is now suppressed, leaving only the phase function ej f(t) . Note that the frequency-domain output of the hard limiter can be broken into two components, namely all those frequency components contained below Ws and all those contained above Ws .
Meanwhile the hard limiter output ej f(t) can be expressed via the identity
ej f(t) = [1 + d(t)]ej f(t) - d(t)ej f(t) (5)
By definition the expression [1 + d(t)]ej f(t) is equal to s(t)/ao , which is bandlimited below Ws . Therefore, -d(t)ej f(t) is the only constituent in the right side of Equation 5 that represents any frequency components above Ws. In other words, when the amplifier is driven to hard limiting the output spectrum above Ws is given by the spectrum of d(t)ej f(t) = D(t), that is, the paraspectrum. Therefore, if s(t) is strictly bandlimited, the hard limiting sidelobes are identical to the paraspectrum.
The paraspectrum, previously believed to apply only at small to moderate signal levels, is now seen to apply even at hard saturation levels. An example follows in which s(t) is very nearly bandlimited, and the result derived previously is confirmed. All spectral calculations are expressed in closed form.2
Example of the Paraspectrum from Hard Limiting
|
|
|
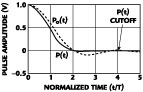
Fig. 2 Data pulse shown in positive time. |
Demonstration of the paraspectrum in the hard limiting case depends on synthesizing a data signal that is virtually bandlimited. On the other hand,2 calculation of the limiter's output spectrum in closed form relies on the choice of an underlying data pulse that is time-limited to a total span of about eight bit intervals. Longer pulses can be used, at the cost of increased computation time, but the limitation of eight bit intervals allows a sufficiently illuminating demonstration of the hard limiting phenomenon. Furthermore, since the same data signal will also serve as a basis of an AM/PM conversion calculation, that signal should also have a fractional ripple component as small as possible. All these factors being considered, the signal chosen was an offset quadriphase shift keyed (OQPSK) signal with the basic bit pulse, p(t), given by

for |t| ≤ 4T, and set to zero otherwise.
This pulse is the product of two main factors. The first factor, called po (t), is recognized3 as a trapezoidal pulse
which is inherently bandlimited when not truncated in time. The second factor in Equation 6, in brackets, is a tapering, or windowing function,4 designed to reduce the spectral sidelobes of the eventual truncated pulse to very low levels. The resulting p(t) of Equation 6 is a Nyquist pulse whose spectral sidelobes are quite small, and which gives rise to only 10 percent RMS amplitude ripple when used in an OQPSK signal. Figure 2 shows po (t) and p(t).
The OQPSK signal now takes the standard form
s(t) = ao p(t) + a2 p(t-2T) + a4 p(t-4T) + ... + ej p/2 [a1 p(t-T) + a3 p(t-3T) + a5 p(t-5T) + ... an p(t-nT)] (8)
|
|
|
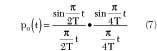
Fig. 3 Power spectral densities before and after hard limiting. |
The spectrum of s(t) takes the same form as that of p(t) as long as the an are random, uncorrelated and most probably equal to ±1. Figure 3 now shows the three spectra of interest, as a function of normalized frequency (f-fc )T, where fc is band center. First, the main lobe spectrum of p(t), and therefore of s(t), is seen to extend to normalized frequency 0.7 and then fall to sidelobes below -90 dB. The main lobe containment of s(t) is slightly better than that of minimum shift keyed (MSK) modulation,5 whose main lobe ends at 0.75 in normalized frequency. Thus, the value of the Ws is 0.7 in the case of s(t). Frequencies below 0.7 will be referred to as the main lobe region, and those above 0.7 will be referred to as the sidelobe region.
The second (dashed line) spectrum is the paraspectrum itself, the spectrum of D(t). The third (solid line) spectrum is the hard limiter output. Clearly, the hard limiter output coincides to within plotting accuracy with the paraspectrum in the sidelobe region, as suggested above. In this instance, maintaining the spectral sidelobes of s(t) below -90 dB appears sufficient to satisfy the hypothesis to within plotting accuracy. The sensitivity of this hypothesis to higher sidelobes of s(t) remains to be investigated.
Extension of Previous Results to AM/PM Conversion
For the analysis of AM/PM effects, the amplifier phase shift must, by definition, be assumed to change with input amplitude. The form of that dependence on input amplitude is the subject of amplifier modeling. In the present instance, the dependence is assumed to be linear, that is an additional phase term of the form
fe (t) = ao kf d(t) (9)
will be added to the amplifier output phase,
where
kf = AM/PM coefficient of the amplifier
Now the r^(t) of Equation 4 is replaced by
r^(t) ej fe(t) = r^(t) ej aok fd(t) (10)
The relatively small ripple of s(t), as reflected in small d(t), becomes important in the next step, as the exponential function is expanded in Taylor's series as
and that series is truncated to the first two terms when the argument is small, such that
ez »1 + z
and therefore, for small d(t)
ej aol fd(t) » 1 + jao kf d(t) (12)
Now the amplifier output, with AM/PM conversion included, is approximated by
r^(t) [1 + jao kf d(t)] = r^(t) + jao kf d(t)r^(t) (13)
where r^(t) is that given in Equation 4. In other words, the AM/PM conversion simply adds to the amplifier output a p/2 phase-shifted version of d(t)r^(t) that is scaled down to the small size of ao kf . After some manipulation the second term in the right side of Equation 13 can be approximated, for small d(t) as
jao kf d(t)r^(t) » j(1 + 0.75k3 ao 2 )ao 2 kf D(t) (14)
The implication of Equation 14 is that the AM/PM effect adds to the amplifier output a properly scaled, p/2 phase-shifted version of the familiar parasignal D(t). Therefore, the net effect of combined AM/AM and AM/PM conversions is a properly scaled and phase-shifted version of D(t), wherein the amount of phase shift depends on the relative amounts of each contributing effect.
A significant contrast between the AM/PM and AM/AM effects, evident from a comparison of Equations 4 and 14, is that the AM/PM sidelobes grow at a different rate than the AM/AM sidelobes. From the second term of Equation 4, it is clear that the AM/AM sidelobe grows as ao 3 . Thus, if the signal amplitude increases by 6 dB, the AM/AM sidelobe increases by 18 dB. This dependence is quite familiar from routine intermodulation tests using a pair of unmodulated CW tones. For small values of K3, it is clear from Equation 14 that the AM/PM sidelobe contribution increases only as ao 2 . Thus, a 6 dB increase in signal level will produce only a 12 dB increase in AM/PM sidelobe contribution.
Example of AM/PM Conversion
|
|
|
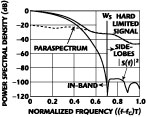
Fig. 4 Spectral sidelobe regrowth from AM/PM effects alone. |
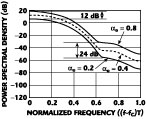
An AM/PM sidelobe regrowth calculation will now be performed on the following assumptions: The AM/PM effect is pure, that is, there is no AM/AM distortion present; the AM/PM characteristic of the amplifier is exactly as in the left side of Equation 12; the value of kf is set to 0.115 radians/volt, a typical value observed empirically; the signal form is the same as that used in the hard limiting calculation above and the signal amplitude assumes the values ao = 0.2, 0.4, 0.8.
The same computational method used previously for AM/AM spectra is readily adapted to produce the family of spectrum plots shown in Figure 4 . Note the strong similarity with the sidelobe shapes in the previous figure, as predicted by Equation 14. Also note that since the AM/AM distortion has been omitted, the value of K3 in Equation 14 becomes zero. Thus the dependence of sidelobe levels on ao is seen to be precisely a 12 dB sidelobe increase per 6 dB of signal increase, as mentioned above.
Conclusion
These discussions have shown that if s(t) is bandlimited the spectral sidelobes from hard limiting are precisely the paraspectrum. If the AM/PM phase dependence causes the phase to change linearly with the input amplitude, then the AM/PM contributions to spectral regrowth are also given closely by the paraspectrum, and those sidelobe contributions grow as the square of the signal amplitude. The AM/PM sidelobe contributions are p/2 phase shifted from those of AM/PM distortion.
References
1. F. Amoroso and R.A. Monzingo, "Digital Data Signal Spectral Sidelobe Regrowth in Soft Saturating Amplifiers," Microwave Journal , Vol. 41, No. 2, February 1998, p. 126.
2. The Spectrum Calculation Program is maintained by R.A. Monzingo of Aerospace Corp., El Segundo, CA; E-mail: robert.a.monzingo@aero.org.
3. F. Amoroso and M. Montagnana, "Distortionless Data Transmission with Minimum Peak Voltage," IEEE Transactions on Information Theory , Vol. IT-13, No. 3, July 1967, pp. 470-477.
4. F. Harris, "On the Use of Windows for Harmonic Analysis with the Discrete Fourier Transform," Proceedings of the IEEE , Vol. 66, No. 1, January 1978, pp. 19-51.
5. F. Amoroso, "The Bandwidth of Digital Data Signals," IEEE Communications Magazine , Vol. 18, No. 6, November 1980, pp. 13-24.
Frank Amoroso received his BS and MS degrees in electrical engineering from the Massachusetts Institute of Technology in 1958, then pursued additional graduate studies at Purdue University and the University of Turin, Italy. His career in the US industry included such organizations as the Hughes Aircraft Co., the RCA David Sarnoff Research Laboratories, Mitre Corp. and the US Army Signal Corps Laboratories at Fort Monmouth, NJ. In 1989, Amoroso retired from industrial employment to begin a new career as a private consultant to a number of industrial firms, including Lincom Inc., Los Angeles, CA. He holds five US patents, has published 30 papers in various archival-quality journals and has taught seminar courses at George Washington University. Amoroso's accomplishments are recognized in the current edition of Marquis Who's Who in America.