
The transmitter unit, contained in base stations for third generation cellular systems, requires a linear power amplifier to preserve signal integrity when amplifying composite signals associated with multiple channels. While the power amplifier must meet a number of requirements to be system level compliant, the design process generally emphasizes and places particular attention to optimizing amplifier linearity and efficiency for a given output power level. Developing such a power amplifier requires exploring the design space (bias point, load line, device sizing, harmonic terminations, etc.) in great detail using either empirical means such as load pull measurements, analytical techniques based on applying large signal model representations of the active device, or a combination of the two. While these techniques can be very useful, effective and powerful for design purposes, qualitative insight into those design constraints affecting amplifier linearity is often less obvious.
The intent of this article is to provide some qualitative insight into spectral regrowth due to the power amplifier nonlinearities for a 3GPP W-CDMA compliant base station (BS) signal.1 The amplifier nonlinearities are represented in terms of gain compression (AM/AM conversion) and phase distortion (AM/PM conversion). Behavioral modeling and simulation algorithms are applied to independently examine and quantify the effects of each on spectral regrowth. Simulation results illustrate that while both mechanisms contribute to an increase in spectral content, limited AM/PM conversion is a key element to achieving high amplifier linearity. Phase distortion resulting from AM/PM conversion is experimentally examined by correcting an amplifier's AM/PM response by digitally predistorting a W-CDMA compliant signal to the amplifier's inverse static phase characteristics.
Spectral Regrowth in 3GPP W-CDMA
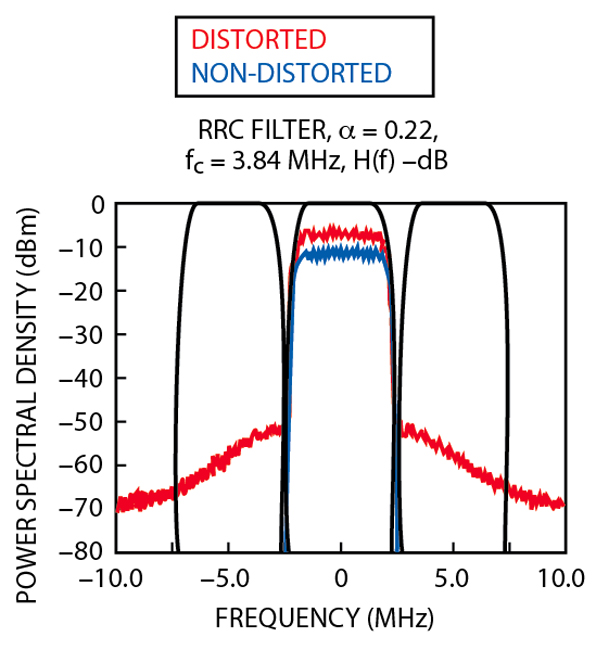
A traditional measure of power amplifier linearity, applied in 2G and 3G cellular systems, considers spectral regrowth or the increase in spectral content of the amplified signal resulting from nonlinearities in the power amplifier. This concept is shown in Figure 1, which graphically illustrates the power spectral density (PSD) for both a non-distorted as well as an amplified and distorted W-CDMA signal.1 The increased spectral content due to the amplifier nonlinearity is clearly evident. A figure of merit known as adjacent channel leakage ratio (ACLR) quantifies spectral regrowth. In the 3GPP standard, it is defined as the ratio of average power in channels offset in frequency by 5 and 10 MHz to power in the main transmit channel. Note that all power measurements are made after passing the signal through a receive filter which is specified as a root-raised-cosine (RRC) filter with a roll off factor (α) of 0.22 and cut-off frequency of 3.84 MHz. The response of the RRC filter is illustrated where it is overlaid on the PSD plots for both main and adjacent channels.
Since a BS signal is the composite or sum of many individual traffic channels as well as control and paging channels, it becomes important to precisely define the properties of each individual constituent channel. This is especially important in evaluating amplifiers as the characteristics of the signal have a major influence on their performance. Factors such as phase alignment, power level, code selection and timing offsets of the individual channels result in widely differing composite signals.2 Hence, it is critical to have a well-defined test signal for purposes of consistency as well as for the test signal to represent a realistic base station traffic scenario. The 3GPP standard1 addresses this issue by including specific details regarding the generation of a compliant signal and specifies that Test Model 1 be used for ACLR measurements. A compliant Test Model 1 signal was developed consisting of 64 traffic channels with spreading factors, timing offsets, code and level settings per the 3GPP specification.
Amplifier AM/AM and AM/PM Nonlinearities

A relatively simple method of describing power amplifier nonlinearities considers AM/AM and AM/PM conversions in a behavioral model.3,4 Assuming a narrow band signal nonlinearity and first zonal components only, a gain transfer function is developed which relates instantaneous complex input and output envelope voltages based on AM/AM and AM/PM data. In practice, power amplifiers generally exhibit near-constant gain with increasing input power until the onset of gain compression, as shown in Figure 2 . At this point, further increases in input power result in slight increases in output power until the device/amplifier saturates. To a first order, and neglecting the soft character in the compression response, it can be represented by a piecewise linear approximation where beyond the onset of compression, output power does not increase. While this representation is at best a loose description of actual PA gain characteristics, it nonetheless is useful in approximating the effect of compressing peak envelope excursions on spectral regrowth.
Estimating the amount of headroom or power back-off needed is an important parameter in designing a linear power amplifier. As greater amounts of back-off are required to meet linearity performance, the amplifier efficiency decreases while the thermal power dissipation increases. In addition, the size and/or saturated power capability of the amplifier must increase accordingly. Hence, larger active devices are necessary; load line impedances decrease thereby making it more difficult to implement amplifier matching structures, all of which add cost and size.
In addition to gain compression, variations in phase with input power (AM/PM conversion) must be considered. This characteristic is much more difficult to generalize. In practice, power amplifiers exhibit an AM/PM response, which may be monotonically increasing, monotonically decreasing, or non-monotonic.
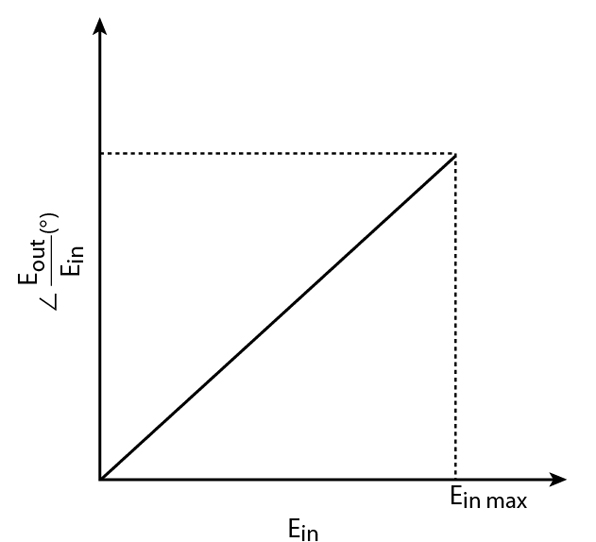
In general, AM/PM conversion becomes more pronounced at higher input drive levels, approaching gain compression. Here and for the purpose of simplicity, a representation is adopted, where AM/PM distortion is linearly proportional to the magnitude of the signal's envelope voltage, as shown in Figure 3. That is, the phase is assumed to vary linearily with envelope voltage over the entire signal's dynamic range.
Estimating the amount of amplifier AM/PM conversion that can be tolerated is also an important design parameter. Allowances in the power amplifier design process can often be made to mitigate, at least to some extent, AM/PM conversion.
Based on the AM/AM and AM/ PM representations shown, a behavioral model consisting of a complex gain transfer function is developed based on techniques illustrated in previous work.3,4
Simulation Results
From the previous discussion a compliant Test Model 1 signal is developed, consisting of 64 traffic channels formed from data sequences occupying five time slots (3.3 ms in length, 5 slots x 666.667 Ωs/slot). This signal is used in all simulations.

The complementary cumulative distribution function (CCDF) illustrating the statistical distribution for this signal is shown in Figure 4 (curve labeled "No amplitude clipping"). The upper portions of the graph indicate that very large envelope excursions are possible as peak-to-average (PAR) power ratios in excess of 10 dB occur.
These large excursions, however, occur relatively infrequently as indicated by their low CCDF probability.
Simulations were first conducted to calculate ACLR as a function of the am
The effect of amplitude clipping on the CCDF is illustrated by the various traces. The resulting ACLR performance at frequency offsets of 5 and 10 MHz is shown in Figure 5.

Both are shown as a function of crest factor, which is simply the maximum PAR of the waveform. Given system level ACLR specifications of -45 and -50 dB (at offset frequencies of 5 and 10 MHz, respectively), the W-CDMA signal can be compressed to a crest factor of near 8 dB and still meet stated system level ACLR performance.
Further, lower ACLR levels of -50 and -55 dB (5 MHz offset frequency) have corresponding crest factors of approximately 9 and 10 dB, respectively.
These simulations suggest that very high peak envelope voltage excursions, which occur with relatively low probability, can be compressed and still meet ACLR performance.
A second set of simulations was performed to examine AM/PM conversion effects. In this case, AM/AM conversion is set to zero (that is no gain compression).
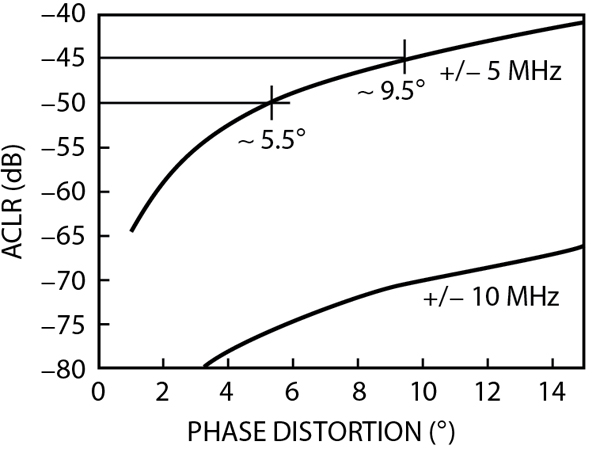
AM/PM conversion is modeled as a linear phase variation with envelope voltage. Simulations were conducted with total phase variations ranging from 1° to 15°. Results are shown in Figure 6 with ACLR values corresponding to 5 and 10 MHz plotted as a function of total signal phase distortion.
The phase distortion shown is the total linear phase variation over the full dynamic range of the signal. These results suggest that a relatively modest level of approximately 10° AM/PM conversion results in an ACLR of -45 dB at a 5 MHz offset. ACLR at the 10 MHz offset frequency remains small. However, it must be noted that the -45 dB ACLR level is a system level specification and not necessarily that of the power amplifier. The power amplifier is often specified with significant margin to the system level requirements. Therefore, if ACLR levels of -50 dB and lower are considered, for example, the tolerable amount of AM/PM conversion becomes quite small - on the order of a few degrees at most. Hence, in developing power amplifiers with linearity margin to the 3GPP specification, AM/PM conversion effects may well be dominant over gain compression.
Experimental Measurements of AM/PM Conversion and ACLR
The preceding analysis was based on modeling the power amplifier nonlinearity using relatively simple methods. In this section, AM/AM and AM/PM conversion effects are considered, via experimental measurements on a relatively high power (7 W) amplifier driven by a Test Model 1 W-CDMA 3GPP compliant stimulus.
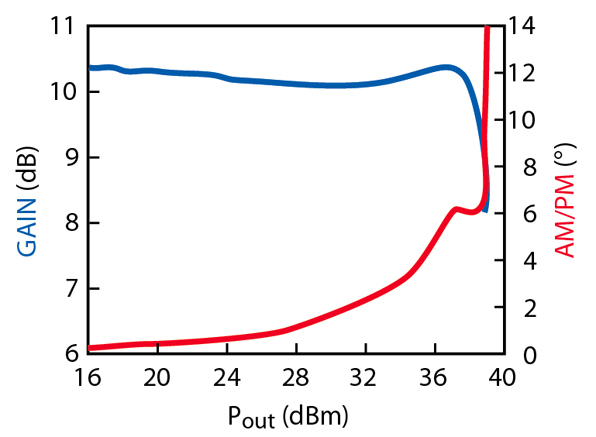
The complex gain characteristics of the amplifier were first measured using a pulsed CW stimulus by driving the amplifier from linear operation into several decibels of gain compression. A pulsed CW stimulus was used to mitigate the influence of thermal and self-heating effects on the complex gain response (Figure 7). The amplifier exhibits a P1dB of 38.5 dBm or 7 W (that is, an output power of 38.5 dBm at 1 dB gain compression). The gain response shows some variation with input power - the gain decreases, then expands slightly prior to the onset of compression. The insertion phase is almost monotonic and increases gradually with drive level except at high power levels where it rises very rapidly.
Given the amplifier's static complex gain response, pre-distortion techniques are applied next, which pre-distort the input W-CDMA signal to correct only for the amplifier's AM/PM conversion. This is done algorithmically by digitally predistorting the base-band I/Q components. Beginning with a W-CDMA Test Model 1 compliant base-band signal s(t), where
s(t) = I(t) + jQ(t) (1)
A pre-distorted signal taking the form
s pd (t) = I pd (t) + jQ pd (t) (2)
is developed by applying a pre-distorter complex gain function Gpd(v) to s(t)
s pd (t) = G pd{ I(t) + jQ(t)} (3)
The function Gpd(v) is the inverse of the phase constituent of the amplifier's complex gain response only. That is
|G pd (v)| = 1 (4)
and
arg(G pd (v)) = - Φ (v) (5)
where
Φ (v) = amplifier's AM/PM conversion
v = magnitude of the input envelope
voltage (v = |I(t) + jQ(t)|)
The function Φ /(ν ) is developed from the measured amplifier's AM/AM data based on a pulsed CW stimulus. The function Gpd-(ν ) is then derived from Φ /(ν ) and is implemented as a polynomial series expansion. Note the magnitudes of s(t) and spd(t) are identical for all points in time and only the phase of the two signals differ. The difference in phase is equal, but opposite in sign, to what the amplifier exhibits. Finally, the signal spd(t) is modulated with a carrier and applied to the input of the power amplifier. Note that a unique predistorted input signal must be developed for each output power level.
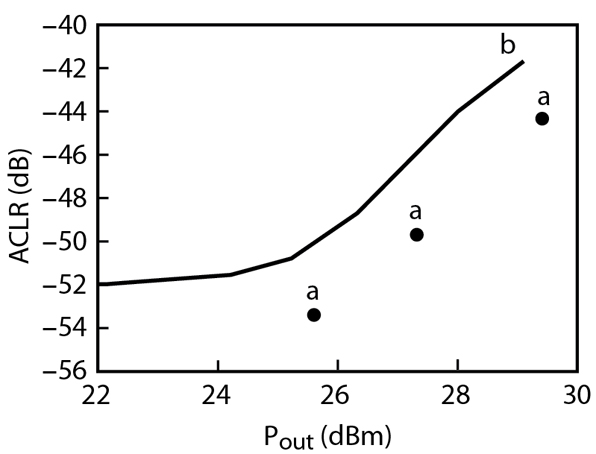
To form a reference to compare against, the ACLR performance of the amplifier is first measured with a Test Model 1 signal over a broad input power range. Next, a predistorted (phase only) Test Model 1 signal is developed and applied to the amplifier. The results are shown in Figure 8.
Consider the performance and the resulting ACLR at an output power level of 25.5 dBm with the amplifier driven by W-CDMA stimulus. This point represents the power amplifier operation at 13 dB output power back-off from the 1 dB gain compression point. Therefore, very limited amplitude distortions occur, mainly at the extreme peak envelope excursion. However, they occur rather infrequently as illustrated by the CCDF. Additionally, lower envelope voltages are distorted somewhat since the amplifier exhibits some gain variation (AM/AM) prior to the 1 dB compression point. Nonetheless, at this power level, it is expected that to a large extent, the amplifier's AM/AM response does not contribute significantly to ACLR. On the other hand, at this power level, the signal is distorted by a significant amount of AM/PM, approximately 8.5° for a PAR of 12 dB. Predistorting the signal to correct for the amplifier's AM/PM contributions significantly improves ACLR to a level near -54 dB.
Measured results are also shown for average output power levels of 27.5 and 29.5 dBm. These power levels represent output power back-offs of 11 and 9 dB, respectively. These signals are distorted by larger amounts of AM/PM conversion, well in excess of 15 for a signal PAR of 11 dB. Predistorting the input signal to account for the amplifier's AM/PM again improves ACLR. The higher ACLR values in these cases suggest that gain compression is a much more dominant effect. Note that these ACLR values are somewhat higher than those predicted by the hard limiter case. This is likely due, in large part, to limitations in the method used to implement the predistorter that become more pronounced at high power levels. Note that it becomes more difficult to account for the amplifier's AM/PM response when peak envelope excursions extend several decibels into compression. As illustrated previously, the AM/PM response for this amplifier rises very rapidly at power levels that drive the amplifier several decibels into gain compression. Therefore, it becomes particularly difficult to measure/model this region of operation accurately. In addition, it must be emphasized that in this work, the predistortion function Gpd(v) is developed from static measurements and as such does not account for any memory effects which may be thermally or electrically produced. Nonetheless, these measurement results clearly confirm that to achieve ACLR values well below -45 dB, only limited AM/PM conversion can be tolerated.
Conclusion
The effects of AM/AM and AM/PM conversion on ACLR performance has been examined for an amplifier driven by a 3GPP W-CDMA BS signal. The results suggest that compressing the peak envelope excursions by several decibels can likely be tolerated. Alternatively, achieving a more linear amplifier, which exhibits ACLR values with margin to the system specification of -45 dB, requires the amplifier to exhibit very limited AM/PM conversion. Experimental results conducted on a high power amplifier provide strong supporting evidence.
Acknowledgment
The author wishes to acknowledge, and is grateful to, Rick Sherman for his considerable support in measurements.
References
1. 3rd Generation Partnership Project Technical Specification Group Radio Access Networks, Base Station Conformance Specification: Radio Transmission and Reception (FDD), TS 25.141 Ver. 3.8.0.
2. N. Deshpande, S. Stanton and M. Hurst, "ACPR Specs Place Demands on W-CDMA Base Station Amplifiers," Wireless System Design, August 1999.
3. A.R. Kaye, D.A. George and M.J. Eric, "Analysis and Compensation of Band Pass Nonlinearities," IEEE Transactions on Communications, Vol. COM-19, October 1972.
4. J. Staudinger, "Applying the Quadrature Modeling Technique to Wireless Power Amplifiers," Microwave Journal, Vol. 40, No. 11, November 1997, pp. 66-86.