

RF communication systems using advanced modulation formats rely on the linearity of signal chain components to meet throughput performance requirements. Nonlinearities result in mixing, which produces harmonics and intermodulation (IM) products. Although passive components such as cables, connectors, switches and antennas are highly linear, then can become significant sources of passive intermodulation (PIM) when transmitting. This article describes the theory, challenges and methods for testing highly linear passive components for PIM.
A linear device or system produces an output signal that is proportional to its input. The resulting transfer function relating output to input can be plotted as a straight line with a slope corresponding to the system gain. Component nonlinearity typically results in the output signal compressing at large input levels. Such a nonlinear transfer function may be approximated by a Taylor series expansion with exponential terms. Frequency mixing occurs in higher order terms (for example 2nd order squaring and 3rd order cubing) producing both integer harmonics and intermodulation products.
Mixer products for a single input tone of frequency ƒ result in output tones at ƒ, 2ƒ, 3ƒ, . . . nƒ with decreasing magnitudes for higher order terms. For narrowband communication systems, harmonics are typically out-of-band and easily filtered out. The 2nd order mixing of two frequencies ƒ1 and ƒ2 results in sum and difference frequencies (ƒ1+ ƒ2) and |ƒ1 – ƒ2| along with harmonics 2ƒ1 and 2ƒ2. The 3rd order mixing of two frequencies ƒ1 and ƒ2 results in mixing products that are near the fundamental frequencies ƒ1 and ƒ2 at |2ƒ1 – ƒ2| and |2ƒ2 – ƒ1| with other products falling well above and out-of-band. The in-band intermodulation (IM) products are difficult to filter out and appear as spurious frequency components. Advanced modulation formats, with many simultaneous frequencies, compound IM products into what is referred to as spectral regrowth. IM products create sidebands leading to adjacent channel interference and increased occupied bandwidth.
IM IN WEAKLY NONLINEAR DEVICES
IM in weakly nonlinear devices such as passive components, switches and linear amplifiers can be approximated by considering only 3rd order IM effects. Practical characterization is simplified by testing with only two frequencies close together and choosing a figure of merit where fundamental power is equal to the third-order intermodulation (IM3) power. This scalar is defined as the third-order intercept (i.e., IP3). The meaning of IP3 is graphically understood by plotting the device transfer function in log-log format. Plotting fundamental power as an idealized straight line with a slope of 1 (extrapolated beyond compression) intersects the theoretical IM3 power of slope of 3 (due to cubing in 3rd order products). The point of intersection corresponds to Input IP3 (IIP3) and Output IP3 (OIP3) as shown in Figure 1.
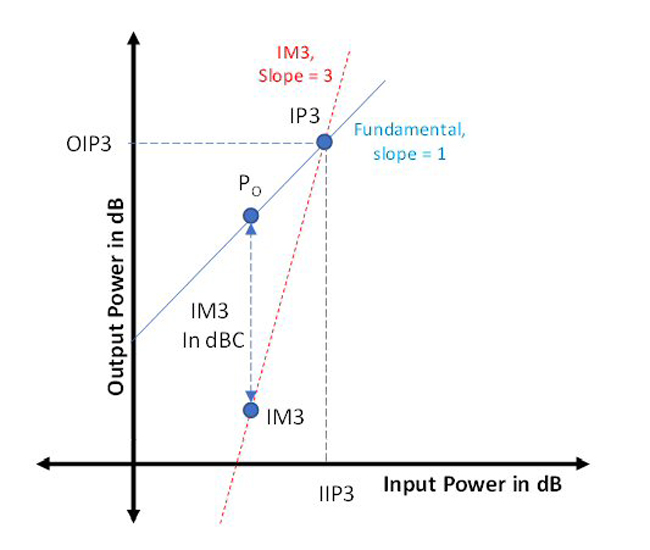
Figure 1 IP3 is the extrapolated intersection of the linear and 3rd order curves.
IP3 is not measured directly and is well beyond the compression point for the device. Instead, IP3 can be computed from a single measurement of the fundamental power PO and resulting IM3 in dBc. Knowing the slopes of the fundamental and IM3 curves on the log-log plot, IP3 can be computed geometrically as:
IP3 = |IM3/2| + Fundamental Power(1)
Fundamental power is the power in both fundamentals ƒ1 and ƒ2 with IM3 being the measured IM in both sidebands |2ƒ1 – ƒ2| and |2ƒ2 – ƒ1|. For practical measurement and filtering considerations, it is easier to measure the single carrier level (SCL) of one of the fundamentals and the IMD in just one of the sidebands. This approach can be taken if the amplitudes of the two fundamental tones are equal, thereby resulting in sidebands of equal power. The test method presented here provides a tone level calibration procedure intended to balance tone power within ±0.05 dB.
IP3 has considerable practical application. Component nonlinear performance can be compared and qualified by the IP3 value itself. The larger the IP3 value, the later the IM products come into play with increasing input power. PIM specifications for connectors and other highly linear components are typically specified in dBc using a standard 2 x 20 W test method.
IP3 is easily computed from PIM by taking care to convert dBW to dBm. From the log-log IP3 plots, it is evident that for every 1 dB increase in fundamental power, IM3 increases by 3 dB. Alternatively, doubling the fundamental power results in quadrupling IM3.
Representative IP3 levels for various components and test standards include: 1) high quality linear amplifiers and GasAs RF switches ranging from 40 to 50 dBm, 2) 95 dBm for a Menlo Micro MM5130 SP4T MEMS RF switch, 3) 116 dBm corresponding to a typical PIM passing test level and 4) greater than 120 dBm for low PIM connectors.
Passive devices have high IP3s and low levels of PIM better than 140 dBc. These high ratios of IMD (fundamental to PIM) raise significant challenges for the hardware measurement test setup. Generation of test tones must be clean and of equal power, properly isolated and combined for input to the amplifier. Low PIM attenuators must be used and mixer levels must be carefully adjusted to ensure IM3 is just above the noise floor of the RF analyzer. Use of low PIM test fixture cables, adapters and load terminators are required in the transmit path. Connectors must be of the right type and properly torqued before measurement. Every path loss must be measured in both forward and reverse directions.
AUTOMATED IP3 TEST EXAMPLE
An automated IP3 test system used to test the Menlo Micro MM5130 SP4T DC to 26 GHz high power MEMS RF switch is shown in Figure 2. Key components include a custom LabVIEW program, a Kaelus 40 Watt PIM tester, a duplexer with a high rejection IM filter, and a spectrum analyzer for IM measurement.
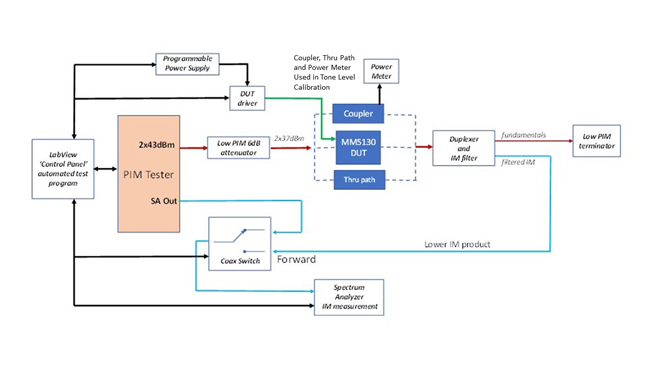
Figure 2 Automated IP3 test system.
The custom program shown in Figure 3 is written using the National Instruments™ LabView graphical programming environment. It provides device under test (DUT) specific selection parameters such as device type and the number of switch channels to test. This information is used by the DUT USB driver for device configuration. Resources including the spectrum analyzer, programmable power supply and coaxial switch are accessed by LabView through the GPIB. Other selection parameters include test chamber temperature, DUT power supply voltage, forward/reverse path measurements, path losses and qualification data. The control panel in Figure 3 is shown prior to starting a test.
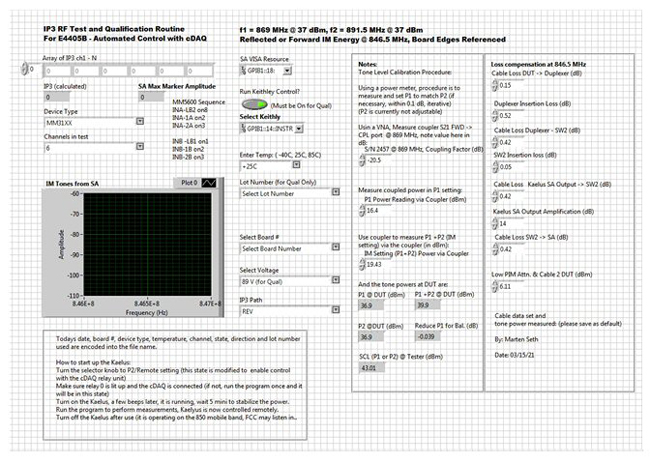
Figure 3 Control panel graphical interface is a custom LabView program.
Test tone power level calibration is performed using a coupler to measure forward power. The control panel includes the tone level calibration procedure, which ensures that the test tones are within 0.05 dB of each other.
Figure 4 shows the two test tones when observed with a spectrum analyzer. The coupler does not remain in-circuit as the power meter will distort the PIM measurement. The test fixture also includes a thru-path as part of the MM5130 evaluation kit (EVK) PCB. Dashed lines in the test system diagram illustrate that only one of the three paths is connected at any one time.
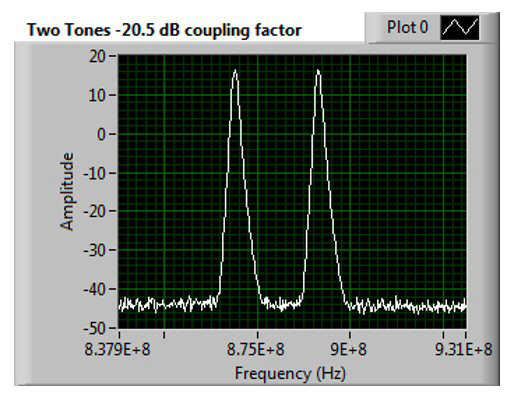
Figure 4 Measured tones of 16.4 dBm, with a coupler loss of 20.5 dB for a tone power of 36.9 dBm.