

This is the third installment of a Keysight Technologies' application note discussing using real-time spectrum analysis to overcome RF/microwave interference in the field. The series consists of five parts, with the remaining installments posted on Tuesdays and Thursdays through September 22, 2016. If you don't want to wait, you can download the entire app note here.
Part 3: Introduction to real-time spectrum analyzers
We are facing two challenges to detecting interference: interference under investigation is much more bursty, due to the time division multiplex nature of digital wireless signals; the other is the spectrum analzyer has too much dead time, which causes missed signals.
The most effective way to mitigate these challenges is to minimize — ideally eliminate — the dead time present in a traditional spectrum analyzer. A new tool is necessary to detect the most challenging signals, called gap-free spectrum analysis or real-time spectrum analysis (RTSA).
Spectrum analyzer receiver architecture overview
To better understand the capability of RTSA, let's look into the traditional spectrum analyzer receiver architecture, its advantages and disadvantages.
Swept tuned receiver
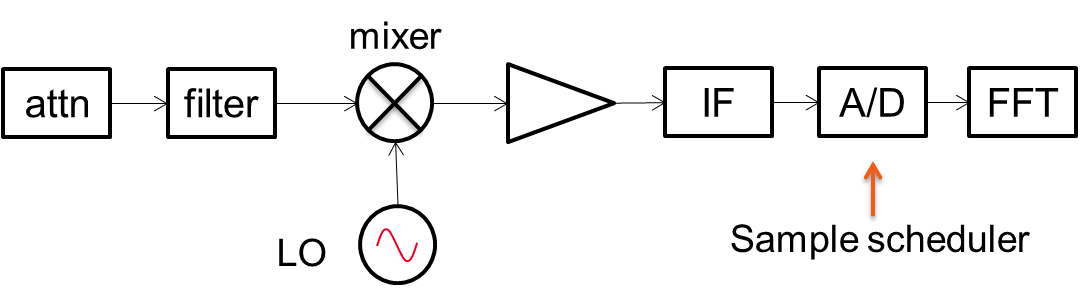
A superheterodyne spectrum analyzer is also called a swept-tuned spectrum analyzer. Heterodyne means to mix; in this system, the RF input signal mixes with the local oscillator (LO) signal to translate the input signal from a higher frequency to a lower frequency, the intermediate frequency (IF). The signal magnitude is detected by an envelope detector and displayed as a vertical point (see Figure 4).

To control the display of the horizontal or frequency axis, a ramp sweep generator is used to control the movement; it also tunes the LO to the expected frequencies. The LO tuning rate can be controlled by setting the sweep time and frequency span.
The front-end of a spectrum analyzer is equipped with signal conditioning circuits, which are attenuators and pre-selectors (lowpass filters). The role of these circuits is to make sure the input signals are at optimum levels before hitting the mixer. Front-end pre-selectors help to block out-of-band noise to improve the receiver's dynamic range and sensitivity.
The tuning LO provides a better selectivity receiver. It naturally blocks unwanted, out-of-band signals, which is why a superheterodyne receiver has excellent dynamic range.
Since the ramp generator sweeps at a fixed rate, it can control sweep time precisely over a frequency span. Controlling the sweep rate enables the receiver to sweep a very large span at a faster rate than a fast Fourier transform (FFT) analyzer.
The biggest disadvantage of a superheterodyne receiver is that it can miss intermittent signals, especially wideband, digitally modulated signals. Another problem is that the sweep time can get dramatically longer at narrow resolution bandwidths (RBW).
Snap shot FFT receiver
The snap shot FFT analyzer or receiver is designed to handle wideband signals. It has a block conversion at the front-end, and the IF bandwidth and analog-to-digital converter (ADC) sample rate decide the block conversion size. Instead of continuous tuning of the LO, the LO steps through the frequency span. After the LO tunes to the right frequency, the receiver samples data through the ADC, converts the samples into I/Q (in phase and quadrature) pairs, places the data into the proper FFT time frames, converts the time domain frame into FFT spectrum data and finally sends the spectrum results to the display — then starts to acquire data again (see Figure 5).
This is a serial operation, so it has a period of time between screen updates when signals at the input will be missed. This duration is called “dead time,” and the length of the duration is unpredictable.
Since it is a block conversion, any signal within the block or information bandwidth will be fully captured for further analysis, such as a digital demodulated signal. Snapshot FFT is ideal for analyzing wideband digital signals; it can reproduce digital receiver behavior based on its signal specification, e.g., LTE signal test.
Since the FFT engine is not able to finish its operation within a specific time frame, it is impossible to precisely control the FFT receiver sweep time. If the signal bandwidth is larger than the information bandwidth of the receiver, signal stitching is required, which can result in missing part of the wideband signal content.
Real-time spectrum analzyer (RTSA)
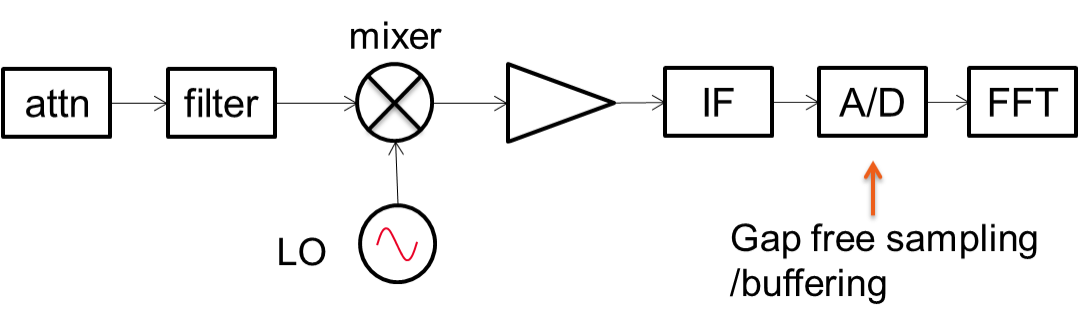
An RTSA is an FFT analyzer without dead time. The receiver is parked at a frequency span of interest, which is limited by the real-time frequency bandwidth. There is no tuning or stepping. It has a large enough signal buffer, FFT engine and display engine to process and empty memory before subsequent data frames come in (see Figure 6).
Within its capture bandwidth, RTSA detects any transient signals, dynamic signals and RF pulses. Nevertheless, RTSA is limited by its bandwidth. When the receiver tries to measure signals beyond its real-time bandwidth, the LO has to be tuned, and during this time it is no longer real-time or gap-free.
Since RTSA has no tuning, the signal to be detected may not be located at the center frequency, and its detected signal level may not be as accurate as when using a traditional spectrum analyzer. So RTSA is not recommended for making accurate power measurements.
RTSA is based on FFT processing, but it removes the dead time of a snap shot FFT analyzer. It processes and displays signals faster than the time needed for the ADC to fill up the circular buffer at a given information bandwidth.
Of course, the downside is that RTSA is always fixed-tuned and bandwidth limited. At a given bandwidth, there is no signal missing. It is ideal for detecting elusive signals. In addition to a super-fast FFT engine and large enough circular memory buffer, the most important technique in RTSA is called overlapping FFT. With overlapping FFT, it is possible for RTSA to reliably detect a narrow pulse with random duty cycle.
Figure 7 shows the signal flow of RTSA. First, the ADC samples data from the IF chain and packs them into each data frame. In the case of Fieldfox, each data frame includes 1024 samples, also the size of the FFT engine. In FieldFox, the FFT size is fixed to improve the efficiency. Instead of processing raw data one frame at a time, RTSA actually rearranges the raw data frame (Data 1, Data 2, Data 3 ...) to new FFT frames (T1, T2 …). Starting from T2, it takes a portion of a sample from T1 and combines it with new data, a portion from Data 2 to form T2. T3 does the same, taking a portion of the sample from the previous T2 and a portion of new samples from Data 2. This is called overlapping FFT, and it guarantees that a signal that occurs at the edge of Data 1 and Data 2 will be properly positioned to the center of the next FFT, to make sure the signal is properly detected.
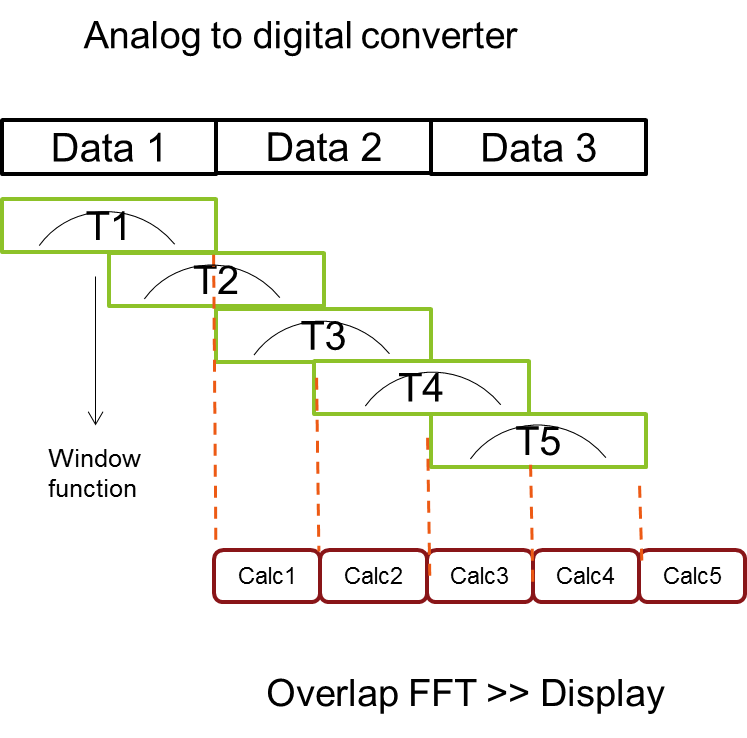
The reason to move the signal to the center of the frame is to prevent windowing from filtering out the useful signal at the edge of the data frame or time record. For illustration, we make FFT calculation and display twice as fast as saving the data to buffers.
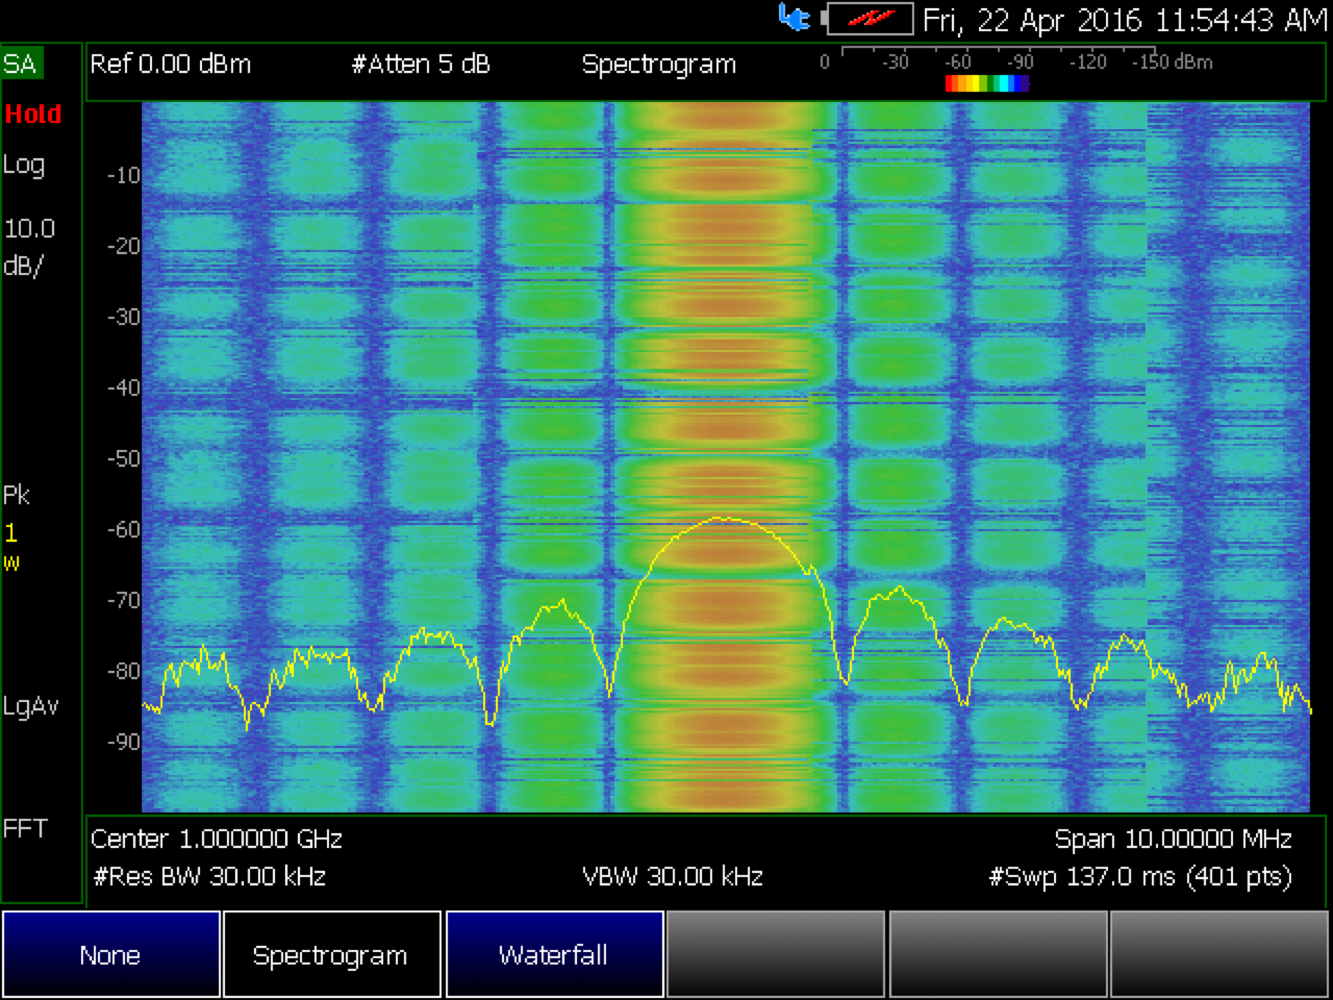
Overlapping FFT dramatically increases the chance of capturing narrow pulses or transient signals. The following screen captures show a receiver which has dead time between updates and no FFT overlapping (Figure 8) and RTSA with overlapping FFT (Figure 9).
RTSA key performance indicators
In RTSA, there are a few key specifications which are critical. One is real-time bandwidth; in general, the larger the bandwidth, the better. The downside is that large bandwidth requires a large field-programmable gate array (FPGA) to process the data. As a large FPGA uses more space and power, a user must trade off portability and bandwidth. For most over-the-air applications, 10 MHz of bandwidth is adequate.
Another specification is minimum signal duration for 100 percent probability of intercept. It is the minimum duration of a signal of interest if it is to be detected with 100 percent probability and measured with the same amplitude accuracy as that of a CW signal. Properly detecting narrow pulse signals in the frequency domain requires a large RBW to ensure the signal falls into the size of the RBW. The large RBW means a small window size in the time domain. If the window size is too small, it may miss signals toward the edge of the window, making it harder to distinguish two or more pulses next to each other.
To reliably detect narrow pulse signals, FieldFox provides an auto mode to optimize the window size (RBW) and overlapping to reliably detect signals of interest.
The primary purpose for using RTSA in the field is to find interference, so dynamic range and input related spurious performance are key specifications. Usable dynamic range is the combination of front-end gain compression, pre-amplifier gain and the noise floor of the receiver.
The front-end RF chain and IF chain signal conditioning play key roles in achieving good spurious-free dynamic range (SFDR). In field testing, there are many over-the-air signals surrounding the receiver. If front-end performance is not robust enough to handle these sophisticated signals, RTSA will have a hard time discerning the signal of interest from self-inflicted spurs.
For example, the lefthand spectrum in Figure 10 is from a low cost, not well designed RTSA. The input signal creates many spurs, some just 30 dB below the real signal. This may lead the user to investigating these phantom interferers and missing the real threat.

On the other hand, a well-designed RF chain significantly improves dynamic range and the ability to detect potential interference. The righthand spectrum in Figure 10 shows the clean spur performance of the FieldFox using the same settings. There are no visible spurs, which makes it very effective for field interference troubleshooting.
End of Part 3. Read Part 2 or Part 4.
FieldFox RTSA software, Option 350, is designed for engineers and technicians performing interference hunting and signal monitoring, specifically in surveillance and secure communications, radar, electronic warfare and commercial wireless markets.