
Techniques for measuring over-the-air (OTA) performance of wireless devices with single antennas do not work as well for multiple antennas because they assume that the radiation pattern of the device is fixed such that the measured result is a snapshot of the device performance at any given instant in time. However, on a device with multiple antennas, software algorithms can change the relationship between the antennas, essentially adapting the radiation pattern to suit the environment in which the device is used. Such adaptation alters the quantity being measured during the measurement process, thus invalidating the test.
OTA metrics such as total radiated power (TRP) and total isotropic sensitivity (TIS) are used to evaluate SISO performance of wireless devices, representing the static properties of the device under test (DUT), independent of the environment in which the device is used. On the other hand, the ability of MIMO devices to adapt to their environment implies that the radiated performance of the device is a function of both the DUT and the environment in which it is evaluated. Since it is impractical to evaluate device performance in the wide range of real-world environments, a laboratory technique for simulating those environments is required.
Conducted test methods can evaluate radio performance for a variety of standardized channel models, yet they make assumptions about the radiated performance of the DUT, leaving out the impact of variations in antenna pattern, spacing, etc., as well as platform interference and antenna loading. OTA testing is required to properly evaluate all these critical factors together.
However, typical radiated test environments such as anechoic chambers or reverberation chambers are not directly suited to this type of testing either. In the traditional single antenna OTA measurement system in an anechoic chamber, the goal of the test is to evaluate the DUT performance from each direction around the device without extraneous reflections. Thus, the chamber is lined with RF absorber to prevent these reflections and ensure that the only RF energy measured is that transferred line-of-sight (LOS) between the DUT and the measurement antenna.
For accurate measurement, the system is intentionally designed so that the entire test volume around the DUT (the quiet zone) will produce nearly the same measurement result no matter where the DUT antenna is located within the test volume. Increasing the number of measurement antennas for the purpose of an N × N MIMO link would still result in N LOS signals between each source antenna and the corresponding N receivers. The resulting channels are all highly correlated, since all antennas on the DUT essentially see the same signal; there is no way such a system could transfer multiple unique data channels across the wireless link. The environment simulated here is the worst case behavior for MIMO, which is a LOS only environment.
Conversely, the reverberation chamber is a system that is designed to take advantage of reflections to measure the power radiated from a device. The measurement antenna becomes the only sink of power in the closed cell, so conceptually the idea is that all energy radiated by the DUT reaches the measurement antenna and vice-versa. Any RF energy introduced in the chamber bounces around within the entire chamber, with some loss each time it encounters a surface. Eventually some portion of that energy reaches the target antenna and is received. The remainder continues reflecting within the environment until absorbed or until it reaches the antenna again. Various "stirring" techniques are used to randomize the field structure to ensure that there are no standing wave resonances within the test volume. The result is a statistical distribution that relates the received power to the transmit power through the net losses of the chamber itself.
The pattern information of the DUT antenna(s) has been averaged out since the direction of propagation between the DUT and measurement antenna has been intentionally randomized. The result is a completely uniform spatial channel that appears as though reflections are coming from all directions (because, of course, they are). While the loading of the chamber can be tweaked somewhat to alter the power delay profile (PDP) seen at the DUT, the actual delays involved are a function of the size of the chamber itself, since larger chambers will have longer delays. In either case, the delays induced by the chamber itself are more typical to equivalent room sized environments than those of an urban cellular network.
From a spatial correlation standpoint, the reverberation chamber produces a test volume with an extremely low correlation, meaning that if a MIMO device is going to work anywhere, it will work in a reverberation chamber; assuming of course that the created PDP corresponds to something the DUT is designed to handle. While the environment produced in a reverberation chamber can be used to test MIMO, the usefulness of the resulting data is unknown, as the environment being generated does not look much like typical real world environments either.
Figure 1 The OTA environment simulator isolates the area around the DUT and stmulates everything outside that region.
Spatial Environment Simulation
In order to properly evaluate performance of MIMO devices in an over-the-air configuration, what is needed is a configurable RF environment simulator that allows emulation of an entire spectrum of RF environments. As noted above, the anechoic chamber and reverberation chamber represent two ends of a broad spectrum of environmental conditions. Most of the real world environments in which devices will be used lie somewhere in between these two extremes. The obvious question becomes: What changes can be made to either of the systems to approximate other environments? Since in general it is easier to add RF signals than to take them away, adding simulation of spatial multipath behavior to an anechoic environment is more feasible than removing multipath from an inherently multipath environment.
Figure 2 An array of antennas in an anechoic chamber simulate reflections from different directions and a channel emulator simulates the propagation of communication signals.
Figure 1 illustrates a typical real world environment encountered by a wireless device. Reflections from scatterers in the environment arrive at the device from various angles of arrival (AOA) and with varying PDPs and angular spreads. If one were to isolate a spherical surface around the device, the conditions within that sphere can be replicated by reproducing the conditions on the surface of the sphere. For the purpose of our environment simulator, we would take the contents of the sphere, including any near field effects such as the impact of head, hands, etc., and recreate those within the isolated environment of a fully anechoic chamber. Events at the boundary of the sphere can then be approximated through the use of an array of antennas, as shown in Figure 2, where each antenna simulates a general AOA relative to the DUT.
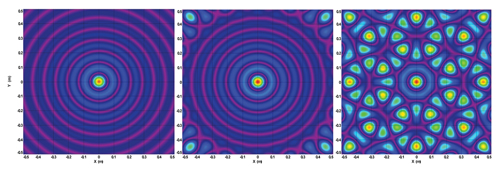
Figure 3 Illustration of field structure produced by a perfect circular array (a), an array of 24 antennas on a 15° spacing (b), and an array of eight antennas on a 45° spacing (c).
Each antenna is fed by the output of a spatial channel emulator that simulates the remainder of the environment outside the sphere. The quality of the boundary condition, and thus the resulting simulated environment, is a function of the number of antennas used to create the boundary. Physical constraints such as physical size, reflections and mutual coupling limit the number of elements that can be used in the array. The cost of the channel simulation required to drive each antenna may further limit the number of antennas used. Since elevation behavior is of secondary interest, typical implementations use a circular array arranged in a plane rather than a full spherical arrangement. Figure 3 illustrates the impact of angular resolution of the array on the quality of the simulated field structure. This translates directly to the size of DUT that can be tested for a given array relationship.
Spatial Channel Emulation
Radios with multiple receivers are often tested in conducted mode using channel emulators to apply appropriate fading simulation. In the most advanced cases, the channel models used contain information on angles of departure (AOD) and AOA, as well as the antenna patterns assumed for both the transmit and receive sides of the channel. Figure 4 illustrates such a case for a 2 × 2 MIMO channel emulation. These spatial channel models can easily be adapted for OTA environment simulation by modifying these models, as shown in Figure 5.

Figure 4 A channel emulator typically simulates the entire propagation channel between a transmitter and receiver, including the behavior of the antennas on the DUT.
The receive antenna information is removed from the model and instead the AOA spread information is used to feed the matrix of OTA antennas with a statistical distribution representing the various clusters within the model. The DUT is then free to use its antennas to integrate the field structure thus generated just as it would with real-world signals. The impact of antenna placement and orientation, as well as the effects of the platform itself, can be readily evaluated. Near-field phantoms can be used to simulate the impedance changes and pattern variations introduced by objects usually found in the vicinity of the device in normal operation. While there are other ways of creating a faded channel between the DUT and any test equipment, this spatial channel emulator concept provides the most versatile way of creating a repeatable, reproducible OTA multipath environment simulation that can mirror a wide variety of real-world environments.
Figure 5 For the environment simulator, the DUT antenna mod.
Some Experimental Results
Data throughput is the logical metric of interest of MIMO performance. Figure 6 shows the results of a set of throughput vs. attenuation (throughput vs. power) tests on an 802.11n access point that supports 2 × 2 MIMO. The data was acquired for a range of device orientations within the simulated environment. This was also compared to the device operation in SIMO mode, where only one of the two downlink channels from the reference device outside the chamber was enabled.
The effect of MIMO behavior of the link is clearly visible over that of simple spatial diversity when in SIMO operation. For high signal to noise ratio (SNR) regions, the throughput is considerably higher than that possible for a single channel. The variation in throughput as a function of device orientation can also be seen. Note that this is not just radiation pattern variation, as the simulated environment is transmitting signals to the DUT from multiple directions simultaneously. This variation is a more complicated relationship that includes the correlation of the antennas due to their spacing and orientation, in addition to their patterns.
Figure 6 Tests of an 802.11n device in the multipath environment simulator show the difference between MIMO operation (upper curves) and simple RX diversity (lower curves).
In addition to the obvious MIMO throughput performance, there are also notable differences in the performance at low SNR when both transmit sources are active. While the general shape of the "waterfall" curve remains constant, the increase in gain over the SIMO case would indicate the presence of transmit beam forming in this particular implementation. Otherwise, the low SNR portions of the curves would be expected to follow the SIMO curves.
The curves contain a considerable amount of useful information about the wireless device's overall performance. However, this amount of detail comes at the cost of test time. A variety of metrics may be extracted from the data. Wireless carriers or network designers will want to know the link budget necessary to maintain a certain level of throughput to the end user. If the network density was well defined, such that the expected minimum field levels could be applied to a target channel model, then the simplest approach would be to perform a simple pass/fail test on the device to determine if it could meet a target average throughput under those conditions. However, that approach provides little information about the relative performance of devices. It is more likely that carriers will want to know the average power level that produces a target minimum throughput—essentially a throughput-based sensitivity test or a MIMO TIS.
System Validation
To ensure that the system produces the desired field structures within the test volume, and thus to have confidence that other target environments can be simulated with appropriate channel models, a number of system validation tests have been performed. These tests are intended to compare actual measured results with theoretically predicted behaviors based on the chosen channel model. Such tests include evaluating the quality of the test volume to evaluate chamber induced ripple, measuring the spatial correlation across the test volume to verify the expected relationship, performing time domain analysis to evaluate the generated PDP, measuring the Doppler spread induced by the faded channel, evaluating the angular distribution of the generated channel(s), and mapping the field distribution within the test volume.
Figure 7 Comparison of the theoretical field structure (a) and that generated in an actual environment simulator (b) for an eight antenna circular array.
Figure 7 illustrates an example of the last case for an eight antenna system with 45° spacing, where a precision sleeve dipole was rotated through the test volume on even angular steps, with 1 cm steps in radius between angular cuts. Since the linear spacing between points increases as the radius increases, the resolution is lower near the edge of the measured data, but the breakdown of the field pattern due to the coarse boundary condition is clearly visible.
Conclusion
In evaluating MIMO performance, it is not sufficient to just create a test that can measure MIMO; the system must be capable of measuring MIMO in a way such that the results predict the expected performance experienced by the user in everyday life. This requires a reconfigurable environment simulator capable of generating a wide range of user scenarios, rather than static test systems that test edge cases that may never be seen in the real world.
Acknowledgments
The author would like to thank Felix Gutierrez for his painstaking efforts in acquiring the field mapping data, as well as the development and production staff of ETS-Lindgren for their support. Thanks also to Elektrobit for the use of its channel emulator.
References
- M.D. Foegelle, "Over-the-Air Performance Testing of Wireless Devices with Multiple Antennas," RF Design, February 2006, pp. 44-52
- M.D. Foegelle, "Systems and Methods for Over-the-Air Performance Testing of Wireless Devices with Multiple Antennas," United States Patent Application Publication 2008/0056340 A1, March 6, 2008
- M.D. Foegelle, "Systems and Methods for Over-the-Air Testing of Wireless Systems," United States Patent Application Publication 2008/0305754 A1, December 11th, 2008
- M.D. Foegelle, "OTA Performance Testing of Wireless Devices with Multiple Antennas," Antenna Measurement Techniques Association (AMTA 2006), PID 524/A06-001
- M.D. Foegelle, "Calibration and Validation of an Anechoic Chamber-based MIMO OTA System," COST 2100 TD(10) 111022, Aalborg, Denmark, June 2010.
Michael D. Foegelle received his PhD degree in physics from the University of Texas at Austin, where he performed theoretical and experimental research in both condensed matter physics and electromagnetic compatibility (EMC). In 1994 he began working for EMCO in Austin, TX (now ETS-Lindgren, Cedar Park, TX), where he is currently the Director of Technology Development. He has been involved in numerous national and international standards committees on EMC and wireless.