

New sensor technologies facilitate innovation in driver assistance systems, vehicle automation, vehicle connectivity and mobility services. With higher levels of driver automation, exterior assistance systems are enhanced by the reshaping of interior systems to provide a holistic driving experience. In this article, we outline how short range radar sensors enable several vehicle in-cabin sensing applications, namely driver monitoring systems and occupancy monitoring systems.
Human-machine interface (HMI) is becoming a domain where automotive manufacturers seek to differentiate. Dating back to 2015, automotive HMI began with simple gesture sensing using IR cameras and MEMS haptic feedback systems. Today we see it trending toward completely personalized, elongated and digital displays such as Byton’s M-Byte 48 inch co-driver display and Daimler’s MBUX. Such automotive clusters will revolutionize human-vehicle interaction.
Sensor advancements in miniaturization, in-dashboard processing, power efficiency and ease-of-integration are enabling newer and sophisticated technologies like radar and time-of-flight sensors. In addition, sensor fusion concepts foretell the future, e.g., combining voice with gesture for robust intended action prediction, illuminating display buttons as a user reaches and differentiating between driver and passenger inputs. The information needed, aesthetic design, environmental factors and cost of computation will define the technology for a specific use case. There are numerous use cases including, but not limited to, comfort applications like gesture sensing and passive safety applications.
According to the World Health Organization, about 1.3 million people die in road accidents almost every year,1 and 73 percent of these accidents are attributed to human error. Per National Highway Traffic Safety Administration statistics, more than 50 children die annually due to hyperthermia after being left in a car.2 Steps have been taken to introduce child presence detection and driver monitoring systems by Euro and Asean New Car Acceptance Programs. The Alliance of Automobile Manufacturers signed a voluntary agreement in Sept. 2019 for rear seat reminder systems,3 while seat belt reminder and restraint systems functional criteria for the EU, Japan and others are extensively described by United Nations Economic Commission for Europe Regulation 16.4 Hence, driven by regulation or legislation, innovative in-cabin passive safety applications are making a difference for safety on the road.
RADAR PROCESSING – A NEW TRANSFORMATION
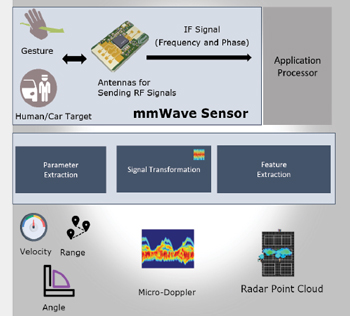
Figure 1 Radar signal processing blocks.
Radio detection and ranging (radar) works via electromagnetic radiation where a high frequency waveform travels through space, interacts with an object and returns an echo or reflected signal back to its source. Most of the information about the object is encoded in the phase and frequency of this received signal. Basic parameters like range, angle and velocity to localize the object can be easily extracted. Further information can be obtained by 2- and 3-dimensional signal transformations such as range-Doppler or micro-Doppler to provide minuscule body motion or even chest movements due to heart and breath rate (see Figure 1). For classification, radar point cloud can also be leveraged.
The ability of radar to aesthetically sense objects agnostic to lighting conditions, maintain data privacy through inherently encoded information and operate in both line-of-sight and non-line-of-sight conditions are some of its unique advantages. Its application, however, depends on the specific use case. Some examples are discussed.
Driver Monitoring Systems
The current state-of-the-art sensor technologies for driver monitoring systems are 2D cameras. These are generally installed directly in front of the driver on the steering wheel or instrument panel close to the speedometer and tachometer. A multi-sensor approach for level 2 autonomy and higher may be required where a holistic physiological understanding of a driver’s wellbeing is important, for example, in a traffic jam assist scenario. Table 1 summarizes some approaches for different use cases.
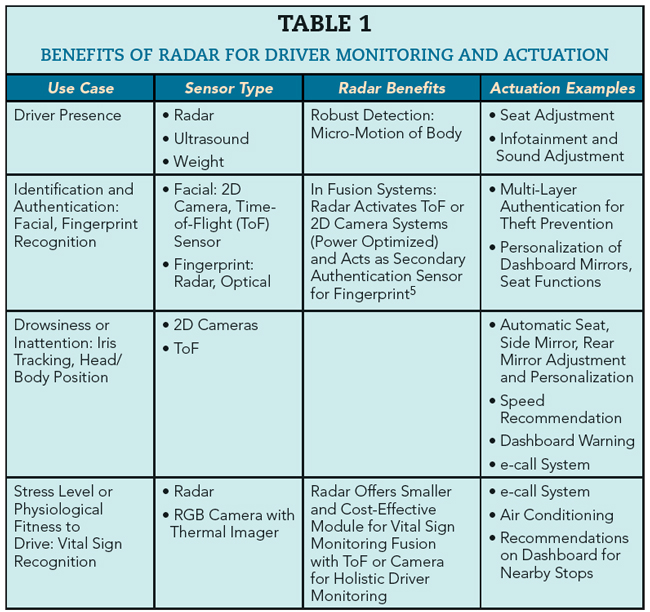
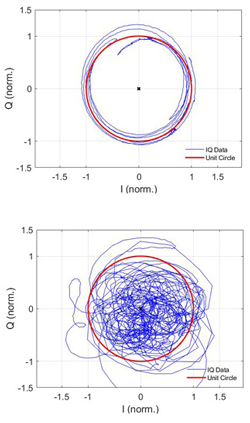
Figure 2 Normalized I/Q plots vs. unit circle, showing high quality vital sign data (a) and data corrupted by random body movement (b).
The standard radar vital sign signal processing pipeline involves a radar interferometry technique to monitor the phase of the detected target over time.6, 7 Following a range fast Fourier transform (FFT), potential targets are selected either through a conventional 1D CFAR technique followed by a peak search on the range spectrum or by using a peak-to-average power ratio (PAPR) metric, i.e. ratio of peak-to-average power across the slow time of each potential target range bin. For a stationary target, the peak FFT value is close to the average/mean of the FFT spectrum along the slow time; where in the case of a vibrating source, such as a beating heart or breathing, the average/mean value is low, resulting in a high PAPR.
Following target range bin preselection, a vital sign Doppler detection is performed by either estimating the standard deviation of the IQ data across slow time and checking if it lies within a prescribed value or using a spectral metric if there are no energy peaks within the vital sign frequencies (0.2 to 3.3 Hz). Doppler detection is an important step before passing the signal through bandpass filters to eliminate static target bins since white noise will lead to validating an incorrect signal.
After vital sign detection, IQ data for the range bins that pass the above criteria is fitted with an ellipse reconstruction algorithm to compensate for offset, phase and amplitude imbalances due to hardware imperfections. Ellipse reconstruction helps to remove these amplitude and phase offsets by mapping the ellipse onto a unit circle.8 Figure 2 is the output of the ellipse reconstruction algorithm for the case of a high quality vital sign target (see Figure 2a) and the case where random body movement perturbs the reconstructed IQ signal (see Figure 2b).9
The resulting signal phase is then passed through a phase unwrapping block to reconstruct the original true phase of the wave from its multiples of 2π values. This is done by adding or subtracting 2π for phase jumps larger than -π or +π, respectively. The unwrapped phase contains the displacement signal:

where λ is the carrier wavelength and φ(t) is the extracted phase over slow time.
The resultant displacement signal contains the superposition of both the breathing signal and the heart rate signal. The displacement signal is passed through bandpass filters, with start and stop frequencies of 0.2 Hz and 0.4 Hz, respectively, for breathing rate estimation and 0.8 Hz and 3 Hz for heart rate estimation.10 There are several approaches for breathing/heart rate estimation, for example:
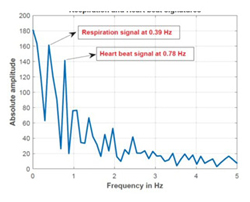
Figure 3 Breathing and heart rate estimation using FFT spectral analysis.
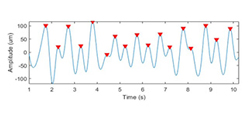
Figure 4 Heart-rate estimation using peak counting on the filtered time-domain heart signal.