
Across the globe, telecommunication regulatory bodies are paying more and more attention to human exposure to RF emissions, with the result that nowadays gaining authorization for installing new antennas is often dependent upon proof of compliance with local reference levels. Compliance becomes dependent on accurate simulation of human exposure to electromagnetic fields, which is the only way to calculate and assess the cumulated level of exposure generated by new antennas in their future installation sites together with all those already in place that are used for cellular networks or radio services.
To address this issue a new version of the EMF Visual software has been developed. The existing version offers reliable and fast calculations and enables the visualization of electromagnetic fields in a determined zone (near-field/far-field), taking into account the multiple emitters and their interaction with surrounding buildings. The simulation results can be compared directly with reference levels given by the International Commission on Non-Ionizing Radiation Protection (ICNIRP), Safety Code 6, FCC. Therefore, providing clear and easy-to-understand evaluations of the compliance of a site.
The new version of EMF Visual is even more powerful thanks to advanced features. It now uses GPU resources, which provide coverage of larger areas for exposure evaluation and enables the use of the Geographical Information System (GIS) database or 3D objects conversion for direct loading of virtual 3D scenes, while interfacing with SketchUp software. In addition, the new version allows users to assign material properties to the entire surrounding 3D environment in order to take into account their impact on exposure levels, while still making fast calculations.
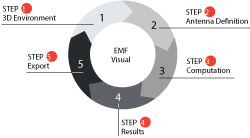
Figure 1 Process utilized by EMF Visual.
The simulation tool is based on a five step process as shown in Figure 1. The first is the definition of the complete 3D scenario. In this phase, the user can define or build a complete 3D scenario based on existing components provided with the software (buildings, ground profiles, etc.) There is a wide range of choice included in the software representing different types of buildings, roads, masts, towers, houses and indoor objects and the user can select different electromagnetic properties for the materials.
Once the scenario is defined, the second step is the antenna selection and installation within the specific scenario. EMF Visual provides a wide database of generic antennas which can be used. In addition, the BSA synthesis module can be used to add custom antennas based on user defined specifications such as: frequency, beamwidth, tilt, input power, gain, etc. The user defined antennas can be exported to the EMF Visual database for use in different scenarios.
The third step is the definition of the computation volume inside the area of interest. Once this is identified the calculation is launched, taking into account the surrounding environment and the interaction with other radiation elements present. The computation is based on ray tracing techniques. The user can select the mesh size of the computation volume and use a non-uniform grid in order to improve the resolution around the antennas and save computation time.

Figure 2 The E-field calculated at each point in the mesh is the superposition of the fields emitted by each sub-antenna of the radiating element.
The E-field calculated at each point in the mesh is the superposition of the fields emitted by each sub-antenna of the radiating element (see Figure 2). Once, the input power (Pin) and phase (α) of each sub-element is known, the total E-field can be calculated at any point (p) in the 3D space as the sum of the individual contributions.
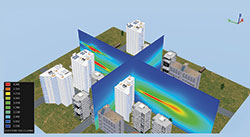
Once the simulation of the scenario is complete, the next step is to visualize the results. The user can define surface or cut-planes to visualize the E-field levels inside the scenario contained within the user defined computation volume. In addition to E-field, the software can display H- field, power density, percentage of power or percentage of field for multi-frequency sources. The software can also automatically determine the safe distance from the radiating element based on the standards/recommendations defined by the European Union, ICNIRP or other regulatory and governing bodies. The user can also change the color and transparency of the results for an optimal view.
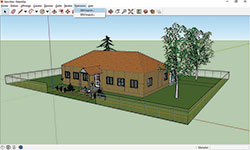
Figure 3 SketchUp import example.
The scenario definition setup in the software package provides several possibilities. It contains the standard EMF Visual tool with CPU or advanced GPU option. For a precise and rapid creation of a 3D environment, several options are available. The user can use the internal generic database, which is quite comprehensive and provides a wide range of buildings, ground floors, towers, masts, indoor objects, etc.
The user can also opt for a plug-in for SketchUP using the SE-SKP-EMF option whereby the user can import custom structures into the EMF Visual software using the SDM format as shown in Figure 3. Another option is the 3D creation tool
(SE-AGETIM-Light-EMF) that generates a complex 3D terrain using the GIS user interface. The detail of the final output depends on the quality of input data.
The third option is the 3D conversion tool (SE-FFT-EMF) that can be used to convert files from VRML, TDF, OpenInventor and OpenFlight formats to the SDM format, which is used by the EMF Visual. This tool is a package of several tools each used to convert to a specific file format.
Microwave Vision Group (MVG) Paris, France
www.mvg-world.com