
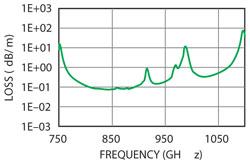
Figure 1 Atmospheric windows in the THz region.
Electronic applications are being developed at frequencies in the several hundred gigahertz (GHz) and even terahertz (THz) regions. Today, most of the work is at the research stage for applications in electronic, chemical, biological and material development. Many organic compounds have molecular resonances above a few hundred GHz, which are being studied for use with spectroscopy for chemical and biological applications. Device improvements in these frequency ranges have also led to a considerable amount of research in networking and radar systems. Although atmospheric absorption resonances make certain applications challenging, there are windows throughout the THz region (see Figure 1) that allow free space applications such as radar, security and radio astronomy.
As new applications develop, there is a growing need for improved material measurement capabilities in the THz region. Lower frequency measurements scaled to higher frequencies were used to support early developmental work; however, these are limited by S-parameter measurement uncertainties and changes in the material parameters. Today, free-space and quasi-optical measurements in the THz region have become more practical. Anritsu and Virginia Diodes Inc. (VDI) are teamed up to deliver a measurement solution that enables the development of many of applications. This article discusses the use of a vector network analyzer (VNA) with THz frequency extenders to accurately characterize materials using a quasi-optical measurement technique.
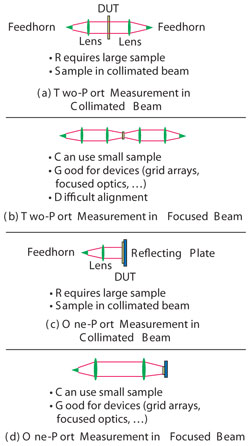
Figure 2 One- and two-port quasi-optical measurements configurations.
Measurement Setup
The test solution may be configured in several ways for quasi-optical measurements. The measurements can be performed using a VNA two-port technique (S21) or a one-port technique (S11). Figure 2 shows four configurations using both techniques. The collimated beam configurations (see Figure 2a/c) require fairly large material samples that can be difficult to obtain. While the two-port focused beam (see Figure 2b) allows for smaller samples, the alignment can be very challenging. The one-port method (see Figure 2d) allows for both a smaller sample size and easier alignment. The one-port method is the configuration used for the measurements described in this article.
Figure 3 shows the measurement test setup. The Anritsu VectorStar VNA controls the test process and provides both the stimulus and response signals. The VDI WM-250 (WR-1) extender module upconverts the signal to the 750 to 1100 GHz frequency range. A feedhorn antenna is attached to the waveguide output of the extender. The radiated signal illuminates the mirror pair (right angle turns) and the beam is focused on the reflecting plate shown on the right side of the picture. The test samples are taped to the reflecting plate.
The VNA (20, 40, 50 and 70 GHz versions) forms the basis for many millimeter wave measurement test solutions. The base VNA can be combined with the 3743A mm-wave modules for broadband coverage from 70 kHz to 125 GHz or used with VDI modules for measurements up to 1 THz. The VNA offers calibration and de-embedding flexibility, making it easier to perform more elaborate and accurate free-space calibrations. It offers excellent stability at these frequencies to minimize phase changes, enabling accurate determination of a material’s permittivity. The VDI WM-250 (WR-1.0) VNA extender offers a dynamic range of up to 60 dB, a magnitude stability of ±1 dB and a phase stability of ±15°. Its compact size allows it to be placed in close proximity of the focusing mirrors.

Figure 3 One-port focused beam quasi-optical measurement test setup.
In our configuration, the focusing mirror and reflecting plate/material sample move as one. This allows the focal point to stay relatively fixed while the collimated portion is lengthened (see Figure 4), providing a more linear phase offset.
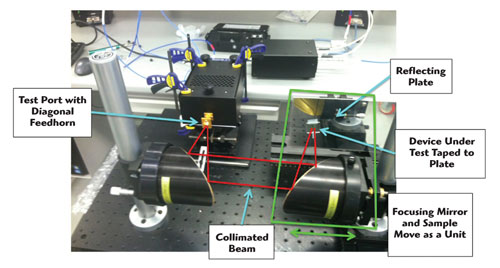
Figure 4 Focusing mirror and reflecting plate/material sample.
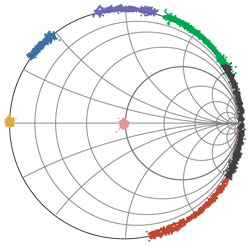
Figure 5 Measured S-parameters of the calibration standards on the Smith Chart.
OverDetermined Least Squares Calibration
The setup is calibrated using the overdetermined least squares calibration technique, as implemented in the Python module scikit-rf.1,2 This technique uses more than the minimum number of calibration standards and solves for the parameters in a least-squared sense. By using multiple standards, the residual errors can be analyzed to provide a measure of calibration quality.
The calibration standards are a series of five delayed reflections with known delay distances. The metal reference plate is at the focal point of the quasi-optical system. As shown in Figure 4, the metal plate and focusing mirror are both mounted on the same stage. This stage is then translated along the direction of the collimated beam using a micrometer to generate the set of delayed reflection calibration standards. A piece of 45 degree angled absorber is used as a matched load.
The overdetermined calibration provides a directly interpretable estimate of achievable measurement quality by looking at the measured S-parameters of the calibration standards (see Figure 5). Use of more than the minimum set of standards provides a more stable solution to the system of equations over a broad bandwidth, and better accuracy. Figure 6 compares the remeasured reflective standards to the load standard, providing an estimate of the smallest measurable return loss given the calibration quality.
Reducing Multipath With Time Domain Gating
In the quasi-optical setup there are a number of inherent multipath reflections (see Figure 7). These multipath signals combine with the desired signal and often result in large ripples across the measured data. The VNA can transform the swept frequency domain data into the time domain to enable the use of time domain gating. Figure 8 shows the time domain result, which can be used to set time domain gating. Transforming the data into the time domain enables removal of most multipath reflections. Through the use of gating, the multipath ripple is significantly reduced, providing measurement results that are close to theoretical (see Figure 9).
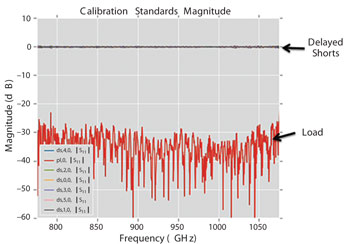
Figure 6 The test setup shows accurate measurements for the calibration standards.
Measurement Results
Aluminum nitride (AlN) and quartz are two dielectric materials commonly used in a number of device processes at these frequencies. Quartz is primarily used as a substrate and AlN is often used as a dielectric or passivation layer. The material samples were taped to the metal reference plate at the focal point of the lens. To estimate the uncertainty associated with the coarse mounting technique, measurements were repeated four times for each sample. In between each measurement, the sample was removed and remounted so that the resultant set of measurements would capture the mounting uncertainty. As shown in the following plots, the repeatability of this method was surprisingly good for such a simple technique.
The known dielectric constant and loss tangent for each material were used to generate theoretical curves for comparison with measured results. Each value was adjusted slightly until the results aligned with the measurements. This guess-and-check method is a simple way to compare theoretical permittivity with that derived from the measurement.
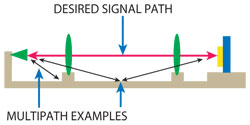
Figure 7 Undesired multipath signals that exist along with the desired signal path.
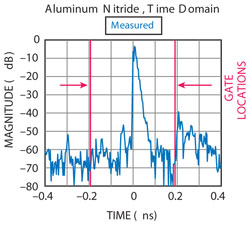
Figure 8 Swept frequency domain data transformed into the time domain to enable use of time domain gating.
Figure 10 shows measured results for the 0.014" thick AlN sample along with the theoretical expectation. The uncertainty bounds are based on repeatability. Time domain gating was used to reduce the ripple effects from the multipath reflections in the test setup. Figure 11 shows the measured results of the 0.039" thick quartz sample along with the theoretical expectation. Time domain gating was again used to reduce ripple effects from the multipath reflections in the test setup. The cusps are due to the reflections at the front and back of the sample interfering and are expected. The cleanliness of the cusps suggests that the planarity of the sample was good.

Figure 9 Time domain gating reduces the effects of multipath reflection; no gating (a), with gating (b).

Figure 10 Measured vs. theoretical results for a 0.014" thick AlN sample; magnitude (a), phase (b).
Conclusion
The quasi-optical one-port measurement solution successfully demonstrates use of the Anritsu VectorStar VNA and the VDI frequency extender to accurately determine the complex dielectric properties of AIN and quartz materials. The measured data shows minimal sensitivity to the repositioning of the dielectric samples and very good repeatability. This technique enables accurate complex permittivity measurements of many technological materials in the THz region.
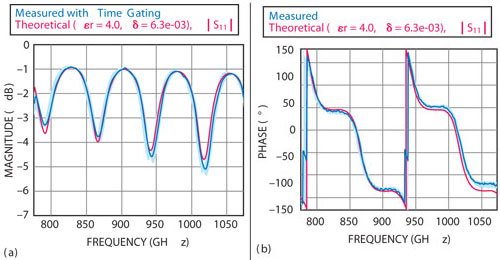
Figure 11 Measured vs. theoretical results for a 0.039" thick quartz sample; magnitude (a), phase (b).
References
- K. Wong, “Uncertainty Analysis of the Weighted Least Squares VNA Calibration,” 64th ARFTG Microwave Measurements Conference Proceedings, December 2004, pp. 23-31.
- A. Arsenovic, L. Chen, M.F. Bauwens, H. Li, N.S. Barker and R.M. Weikle, “An Experimental Technique for Calibration Uncertainty Analysis,” IEEE Transactions on Microwave Theory and Techniques, Vol. 61, No. 1, January 2013, pp. 263-269