


Figure 6 demonstrates that no further details of SLL above -45 dB can be seen by using the enlarged scan surface. Therefore, there is no need to further enlarge the scan surface beyond the reference scan surface. By using the reference scan surface setting, only 14,746 of the 202,500 test points are tested. Thus, an SNF pattern test for both azimuth and elevation patterns can be completed within three minutes of test time.

Figure 6 Patterns from (a) azimuth reference scan, (b) elevation reference scan, (c) azimuth enlarged scan and (d) elevation enlarged scan.
Stability of the Test System
Due to the required test time, test data from the SNF test system will be necessary to compare to test data acquired days ago. The stability of the test data over time is critical. Table 2 shows the intercompared radome-off pattern peak values tabulated with the panel antenna fixed. Table 2a shows the values at nominal test distance, Table 2b shows the values at the nominal test distance plus a quarter wave shift and Table 2c shows the average values from Table 2a and b. These shifts simulate the radome being oriented to 21 x 11 angular positions. An SNF scan is performed and transformed to far-field at each radome positioner setup. Peak gain values are entered into the tables as the radome transmission efficiency (TE) reference data. Five days later, the same 231 SNF scans were also measured, and the results were compared to assess the test system stability. The data includes variation due to environmental changes, such as temperature and humidity, over the six days.

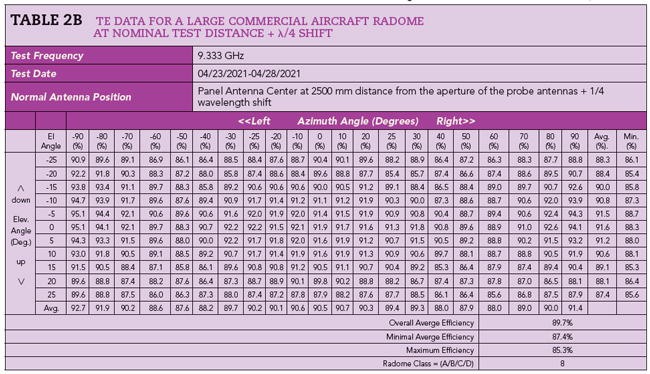

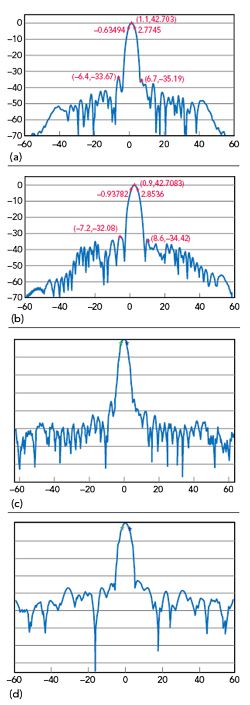
Figure 7 Large radome-on intercompared measured far-field (a) azimuth from this SNF, (b) elevation from this SNF, (c) azimuth from an outdoor far-field range and (d) elevation from an outdoor far-field range patterns.
It has been tested and found that the maximum difference of all peaks between two sets of pattern tests over a time span of six days is between -0.011 and +0.027 dB. Also, based on the RTCA test plan, the maximum average deviation between the two tests among 11 elevation angles is less than 0.00417 dB, or at 0.096 percent. Therefore, the overall average TE deviation due to the system stability is less than 0.0027 dB, or 0.062 percent. This test also demonstrates the potential to measure only one reference pattern peak rather than 231 repeated measurements because the variations are so small as to be negligible.
Far-Field Antenna Pattern Verification
The first verification is to evaluate the beamwidth and its SLLs by comparing the transformed far-field patterns from the SNF data to patterns obtained from a far-field range. Two pattern cuts, horizontal- and vertical-plane, are compared against far-field patterns measured at an outdoor far-field range. Figure 7 shows the intercompared antenna patterns.
It can be observed that the two sets of patterns compare very well in both their main beams and SLL down to as low as -45 dB within the scanned azimuth and elevation angular ranges.
Test Distance λ/4 Movement
In the latest RTCA test plan, a λ/4 shift is required to average out the pattern peak variations due to the NF coupling between the probe(s) and the AUT using the SNF method. This SNF system implements the feature by providing a linear slide in the multi-probe carriage. At 9.333 GHz, the λ/4 radial shift is an 8.03 mm increase in the nominal 2500 mm test distance.
It was observed that the changes in pattern peaks with λ/4 shift present negligible changes in the TE measurement when the test distance in the SNF range is more than 75λ in electrical length.
Transmission Efficiency Verification
After the qualification of the SNF test system, the most time-consuming TE measurements are performed by completing a set of 231 panel antenna radome-off patterns. Since a λ/4 shift pattern test is not expected to be needed to average out the NF coupling error, no data for λ/4 shift in test distance are collected for radome-off measurements.
With radome-on, the pattern peaks are measured for all 231 possible radome/antenna orientations at both nominal and λ/4 shift inclusive range distances. The TE shall be obtained by comparing their pattern peak values against the corresponding radome-off reference peak values. The average TE for the nominal and the λ/4 shift inclusive range distances are then compared against results from an outdoor far-field range.
Table 2 presents the measured TE for a large commercial radome with a panel radar antenna; the overall average TE is 89.8 percent, and the minimum averaged TE among 11 elevation angles is 87.5 percent; the minimum TE among all 231 points is at 85.5 percent. Based on the published radome class ratings, this is a Class B radome. The same radome has been tested at an outdoor far-field range and reported at an overall average TE of 90.8 percent, a minimum averaged TE among 11 elevation angles of 88.6 percent and a minimum TE among all 231 points of 83.0 percent. The outdoor range report also rates this as a Class B radome. The two ranges, although utilizing completely different test methods with a two-month time span between the two test methods, generate less than 2.5 percent minimum TE difference in the worst case.
The TE results of all radomes of three different sizes, with two different panel radar antennas, compare well with reported test results from two outdoor ranges in both TE reading and in radome classification. Additionally, the test results with λ/4 shift in test distance do not show any appreciable difference and demonstrate a variation for all three radomes much lower than 0.1 dB with two different system antennas. These variations do not result in any change in the radome classifications. Therefore, the TE tests with λ/4 shift in test distance should be omitted in the SNF test range if the test range distance is greater than 75λ.
Radome Incident Reflection Measurement
A response and isolation calibration can be performed at the input port of the X-Band waveguide connecting the panel antenna, and when the panel antenna is mounted at the radome-off configuration. The calibrated SNF can easily achieve a background VSWR of less than 1.02 or -40 dB in the RF system’s background reflection noise. When the radome is mounted in front of the panel antenna at radome-on configuration, the incident reflection (IR) is measured with the panel antenna incident at 15 different positions to the radome. Table 3 shows the sample measured IR from the largest commercial aircraft radome.

Beam Deflection, Pattern Distortion and SLL
Beam deflection and pattern distortion were first tested at the radome-off configuration for the pattern stability over a period of more than 48 hours. It was demonstrated that the SNF test system has a worst-case peak value difference of less than 0.003 dB and a beamwidth difference of less than 0.002, which is approximately a 0.09 percent change between two azimuth plane pattern results. The maximum sidelobe difference is 0.79 dB at -35 dB SSL. The tests were done for a smaller radome in the beam peak deflection between radome-off and -on. The test results show a less than ±0.2 degrees beam peak pointing error at the radome-on. The averaged small radome antenna pattern beamwidth distortion test data at both nominal and λ/4 shift inclusive test distance also shows a much less than ±0.2 degrees beam peak pointing error. The SSLs have been verified to comply with the test requirement and agree with test reports from other sites.
CONCLUSION
A multi-probe SNF test system with several unique features has been developed to perform all required antenna pattern testing fully compliant with the latest RTCA DO-213A Change 1A. The system has been verified for accuracy and repeatability and has demonstrated excellent performance. With proper selections of the SNF scanning test parameters and careful considerations of the AUT energy concentration, the multi-probe test system can also be efficient in test time.
The fixed panel antenna position and the fixed scan surface range configuration are found to be crucial factors in this test system’s accuracy and repeatability. By adding the roll positioner in the radome handling, both EL/AZ and AZ/EL gimbal systems for the panel antenna can be simulated and tested for the radome-on AUT patterns. A coordinate conversion calculation has been provided.
Furthermore, by using the longer test distance in the SNF system, the NF coupling error in both radome-off and radome-on antenna pattern tests is negligible. This may allow further enhancement in test time by eliminating redundant, time-consuming TE pattern tests.
ACKNOWLEDGMENT
The authors would like to thank Boeing Tianjin Composite and Boeing Seattle technical staff for their help and support throughout this project. Many thanks to the engineering teams of both ETS-Lindgren China and Nanjing MJK Engineering for their effort in overcoming many unforeseen hardships, especially during the COVID times. This project could not have been completed successfully without the teamwork of these parties.
References
- 1.D. W. Hess, R. Luna and J. McKenna, “Electromagnetic Radome Measurements: A Review of Automated Systems,” January 2005.
- 2.M. L. Goff, N. Adnet, N. Gross, L. Duchesne, A. Gandois and L. Durand, “A Novel and Innovative Near-Field System for Testing Radomes of Commercial Aircrafts,” Proc. AMTA 2017, October 15-20, 2017.
- 3.J. Wilbur, “Low Cost Automated RTCA DO/213 Compliant Radome Test System,” Proc. AMTA 2011, October 16-21, 2011.