

As mobile and wireless communication applications demand ever-increasing data rates, the corresponding need for wider modulation bandwidths and higher modulation orders continues to grow. These requirements dictate a better signal-to-noise ratio to hit the right point in the constellation diagram. Consequently, key components used for these applications must demonstrate a performance close to their physical limit. However, the dynamic range of contemporary signal analyzers falls short when measuring the performance of these components over a wide frequency and power range. Current strategies to overcome these limitations include IQ averaging or cross-correlation signal processing techniques.
TODAY’S WORKAROUNDS
IQ averaging is a technique commonly used for noise cancellation, but this method requires a repetitive signal. Averaging the same IQ data several times reduces the random Gaussian noise, whereas the signal or the IQ vector remains consistent across all captures. This strategy enhances the dynamic range and minimizes the noise added by the measurement instrument. Despite being implemented in current analyzers, this method has limitations.
When there are no repetitive signals, cross-correlation techniques are employed to overcome limitations in the dynamic range. This technique requires two signal analyzers, which must be time-aligned, necessitating additional signal processing for cross-correlation calculations. Unfortunately, this not only increases measurement complexity but also test costs.
Other instruments, such as oscilloscopes, may offer two or even more inputs for this application. However, oscilloscopes typically have a restricted dynamic range. The analog-to-digital converters are optimized for wideband digitization of signals, a characteristic that does not improve the situation, even when cross-correlation techniques are applied. PXI modules with multiple inputs typically have a wider dynamic range; however, the lack of preselection limits the dynamic range when unwanted signals are located at the image frequency or unwanted mixing products fall within the band of interest.
ENVISIONING NEW ARCHITECTURES AND NEW POSSIBILITIES
What if signal analyzers were designed to have two internal receive paths? Such an architecture could suppress unwanted signals at the image frequency or unwanted mixing products via preselection at the input. The two paths, including the splitter, could be aligned, calibrated and equalized by the instrument manufacturer. Cross-correlation can be activated with a simple button push, eliminating the need for external splitters and additional calibration steps. If the internal splitter is not used and the two RF input ports are directly routed to the receive unit, multiple receive paths can be used for all modern mobile or wireless communication standards, such as WLAN or 5G, as well as radar applications. Figure 1 illustrates the potential of a new architecture featuring two receive paths for enhanced performance.
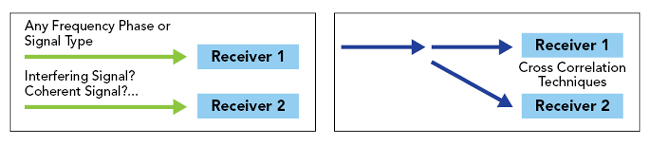
Figure 1 New architecture opens possibilities for new levels of performance.
CROSS-CORRELATION TECHNIQUES DRAMATICALLY ENHANCE PHASE NOISE ANALYZERS
The implementation of cross-correlation could have implications beyond the dynamic range. It could also yield measurement results unattainable with traditional signal and spectrum analyzers. Already known from professional phase noise testers, such as the Rohde & Schwarz FSWP and the Rohde & Schwarz FSPN, cross-correlation techniques are used in phase noise measurements to suppress the phase noise of the internal local oscillators in the phase noise tester. This is relevant since modern communication applications often operate at higher frequencies, where the phase noise of the oscillators scales with the frequency, f, by 20 log (f). This phase noise impacts EVM performance directly as the frequency increases. An unstable phase reading makes it difficult to detect the correct constellation point in the constellation diagram. As a result, the system may have to switch to a lower-order modulation scheme, reducing the data rate. For this reason, the synthesizers or oscillators must be measured accurately to ensure optimized phase noise performance. Consequently, modern communication applications often require expensive phase noise testers and a good signal and spectrum analyzer. This is due to the limited measurement performance of the analyzer caused by the internal local oscillator.
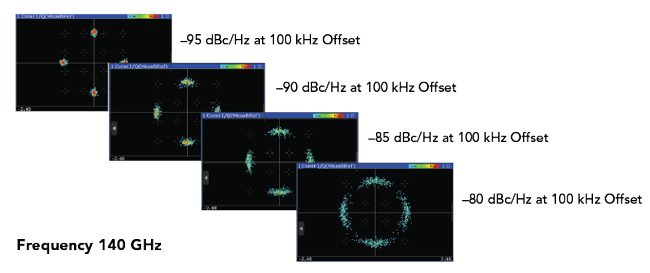
Figure 2 Phase noise performance is critical to achieving high data rates.
Figure 2 shows how the performance degrades on a QPSK signal with a sample rate of 20 MHz as the phase noise increases. The transmitted information is quite clear with a phase noise of -95 dBc/Hz at a 100 kHz offset. However, the information deteriorates with increasing phase noise. At -80 dBc/Hz, it becomes quite difficult to decode the correct data from the signal. The system must step back to BPSK modulation, which reduces the data rate. A phase noise performance of at least -90 dBc/Hz is needed for QPSK, which is quite challenging at a 140 GHz center frequency. This illustrates the need for test and measurement equipment with cross-correlation capabilities to accurately measure phase noise, enabling optimization of oscillators and synthesizers.
FINDING HIDDEN SPURS QUICKLY
For modern radar applications, detecting targets with a small radar cross-section (RCS), such as drones, is becoming increasingly important. This necessitates an enhancement of test equipment sensitivity for these applications. A key to this effort is lowering the receiver’s wideband noise floor and improving the local oscillator’s phase noise performance. This will help reveal the RCS reflection of a small target that is no longer hidden by clutter reflection after a slight Doppler frequency shift.
Beyond reducing phase noise and suppressing wideband input noise, the ability to detect small unwanted spurs and interferers in the system is also crucial. These small signals could be misinterpreted as targets, limiting the application’s sensitivity as the trusted level for detecting real targets would need to be increased. Currently, signal and spectrum analyzers detect these small unwanted interferers. However, to see spurs close to the noise floor, the spectrum analyzer’s resolution bandwidth (RBW) needs to be reduced to just a few hertz. This significantly slows down the sweep due to the prolonged settling time of the filters. Consequently, this technique requires a long measurement time to characterize the system and detect unwanted interferers.
What if the architecture of a receiver included two paths, allowing users to apply cross-correlation? This could suppress the inherent noise floor of the signal analyzer down to the physical limit without the need to reduce the RBW. This would enable faster sweeps at very low intrinsic noise levels compared to an analyzer, where a small RBW must be applied, which again limits the sweep speed due to the settling time of the RBW.
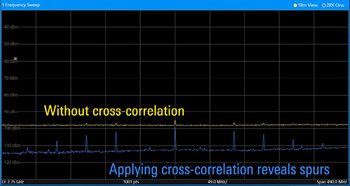
Figure 3 Measurement results using RMS detector (top) and cross-correlation techniques (bottom).

Figure 4 Comparison of filter bank and YIG filter frequency response.
In Figure 3, the bottom trace displays the measurement obtained when a cross-correlated detector is employed. For comparison, the top trace shows the measurement using an RMS detector. At an RBW of 1 MHz, the spurs are barely detectable, if at all, by the RMS detector. These results show that cross-correlation techniques can lower the test noise floor with only a slight increase in measurement time.
OVERCOMING THE PREVIOUS WIDEBAND CHALLENGE OF YIG VERSUS PRESELECTION FILTERS
Standard signal analyzers attempting wideband modulation analysis currently lack preselection for IQ analysis at microwave frequencies. Up to a specific frequency of several GHz, the signal is up-converted to a high intermediate frequency with the image at much higher frequencies. A lowpass filter is used to suppress the image. However, at frequencies above 5 to 10 GHz, depending on the instrument used, up-conversion for image suppression adds too much noise. Therefore, YIG filters are used for preselection at these frequencies to suppress unwanted images. These YIG filters have a limited bandwidth of 50 MHz, maximum, depending on the frequency range. They also exhibit a strong ripple, in the range of several dB, which prevents them from being used for IQ analysis. For IQ analysis, the YIG filter must be bypassed and noise or unwanted signals at the image frequency will cause the measurement results to deteriorate.
What if this challenge could be overcome by using filter banks? Filter banks for preselection have wide bandwidths and show a flat frequency response. This provides high-level accuracy, making it ideal for IQ analysis. Wideband IQ analysis with image suppression would be possible at an analysis bandwidth much wider than 50 MHz. This analysis bandwidth could range to several GHz, depending on the IF frequency and the analog-to-digital converters. This would increase the dynamic range and reduce the error due to interferers at the image frequency. In addition, with a flat frequency response, the absolute error for level measurement of CW carriers or spurs would be significantly smaller, as the YIG filter ripple would cause no deterioration. Level measurement uncertainties in the range of 1 dB or even better would be possible in the microwave range with preselection, making an additional power sensor unnecessary for certain applications. This would enable the accurate specification of spur levels for radar applications. Figure 4 visualizes the difference between filter banks and YIG filters. From the diagram in Figure 4, it is evident that, despite less out-of-band signal suppression, a filter bank offers wider, adjustable bandwidths and a flatter frequency response compared to YIG filters.
YIG filters can be quite slow and inaccurate for spectrum analysis, where users sweep over a wide frequency range. Filter banks for preselection could make the analyzer 10x to 20x faster for spectrum analysis, as they can be switched much faster than a YIG filter can be swept. However, the signal suppression in the stop band is more than 20 to 40 dB lower than that of the YIG filters.
A combination of both would be the most effective solution. The analyzer could use the YIG when narrowband spectrum analysis is required to detect the smallest unwanted interferers. Then, the analyzer could use the filter banks for IQ analysis or to improve measurement speed. Filter banks, in combination with a multipath receiver structure, can also be a helpful tool for spur searches. This is because inherent LO-related spurs of the spectrum analyzer can be easily suppressed when measuring with different IF receive path frequencies, as the spurs appear at different frequencies. A simple NAND operation can suppress these inherent unwanted emissions.
SIMPLIFYING THE SETUP FOR PHASED ARRAY ANTENNA TESTING
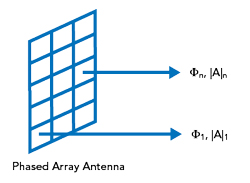
Figure 5 Comparing one element to the nth element in a phased array antenna being tested under modulated conditions.
Beam steering applications in aerospace and defense, as well as mobile communications and automotive radar, often use phased array antennas. The phase between different transmit paths needs to be well-aligned and tested for these antennas. What if a signal analyzer setup could measure these scenarios with multiple phase-coherent paths during the calibrated initial phase? Each channel must be phase-coherent to determine the beam accuracy precisely. It would also help evaluate a phased array antenna under modulated conditions, where one element needs to be compared to the nth element, as illustrated in Figure 5.
A vector network analyzer (VNA) can be used in this scenario, but the process can become slow when stitching is required for modulated conditions. Alternatively, an oscilloscope can be used, but this comes with the limitation of a restricted dynamic range. PXI modules, which share the same local oscillator, offer a wider dynamic range, but neither solution typically applies preselection. Without preselection, signals at the image frequency may further restrict the dynamic range and overcoming these limitations requires setups that can become quite complex and prone to errors.
RADAR TEST: IMPACT OF SIGNAL INTERFERENCE
To effectively capture the entire scenario and analyze the mutual interference created by signals governed by different communications standards at various frequencies or between communications and radar signals, requires an analyzer with a very wide bandwidth. Alternatively, an analyzer with different inputs or with one input and different receivers can also be used. With oscilloscopes or PXI-based signal analyzers, special input settings, such as attenuation or preamplifier gain for the other signal receive paths, cannot be adjusted. This restricts the dynamic range for a measurement scenario, where, for instance, the small higher harmonic levels of a radar application need to be detected with a strong mobile communication signal present. Additionally, the available analysis bandwidth limits the frequency range that the analyzer can capture.
Consider the potential of a signal analyzer with multiple inputs or a multipath structure, where different frequencies can be set for the local oscillators or various levels of gain or attenuation can be set at the input. Such a setup could even trigger at a completely different frequency than the frequency at which the measurement is done. Imagine being able to trigger on a Wi-Fi burst at 2.45 GHz and observe whether the radar signal is affected, as illustrated in the example in Figure 6.

Figure 6 Analyzing the effect of a Wi-Fi signal at 2.45 GHz on a radar signal at 6 GHz
MODULATED COMPONENT ANALYSIS: A BETTER WAY?
What if the ability to measure two signals simultaneously, at different frequencies or even the same frequency, could also be used to characterize components? Users could compare the signal-to-noise ratio or EVM performance at the input and output of an amplifier. This could also be done for up- and down-converters with different frequency settings. Both signals would be captured simultaneously and the modulation of the input signal would not even need to be known; the user could compare the IQ data.
TESTING ELECTRONIC WARFARE DRFMS
This future scenario also holds promise for electronic warfare applications. Users could examine their application’s input and output and analyze the signal’s phase and amplitude in real-time. What if modulated pulsed radar signals before and after the digital RF memory could be captured simultaneously, allowing for the characterization of amplitude and phase variations to optimize the system for effective jamming applications?
Again, these measurements could be performed on a VNA, but these instruments typically have a restricted analysis bandwidth. Oscilloscopes could also be used, but their dynamic range is limited and may not reveal the necessary phase and amplitude modulation details. Furthermore, oscilloscopes typically do not provide internal analysis tools to perform this effectively, necessitating the use of external software solutions.
CONCLUSION
Contemporary signal and spectrum analyzers have considerable limitations when addressing emerging technologies. This article proposes a new architecture and possibilities that could overcome these limitations. By implementing two internal receive paths, preselection at the input and built-in cross-correlation in signal analyzers, the dynamic range can be enhanced, measurement speed increased and test setups significantly simplified. The potential of these advancements can revolutionize the way we analyze signals and spectra. At Rohde & Schwarz, we actively explore these possibilities and work toward making them a reality.