

Quartz crystal oscillators are commonly used in many electronic systems to provide a very stable frequency source or reference. Crystal oscillators will provide a very clean and relatively noise-free signal when they are in a benign environment and are not experiencing any movement or acceleration forces. However, any change in position or periodic movement, such as vibration, will cause a change in the operating frequency of the oscillator. In many applications, these frequency changes are minimal and may go unnoticed, having no discernible effect on the device’s performance. However, for systems that experience a high level of vibration, the output signal may be significantly degraded and may disrupt system operation.
The acceleration sensitivity of a crystal is also commonly referred to as “g-sensitivity.” This is usually denoted by Γ. Acceleration forces cause a change in the resonant frequency of all quartz crystals to some degree. This is primarily due to the stress that is applied to the active area of the crystal through the mounting structure. This change is relatively minimal. A typical quartz crystal will measure < 2×10⁻⁹ per g (0.002 ppm/g or 2 ppb/g). This effect goes unnoticed in many applications but can become very significant in the presence of vibration. The acceleration sensitivity is linearly proportional to applied force up to acceleration levels around 50 g, depending on the crystal mounting structure. One other aspect to be considered is that Γ is a vector quantity and therefore, the frequency shift is highly dependent on the direction of the applied force.
SINUSOIDAL VIBRATIONS
Crystals in many applications experience some level of periodic vibration. The instantaneous frequency of the crystal will shift according to the direction and magnitude of the applied force. During a periodic vibration, the direction of the force is continuously reversed so that the frequency shift goes from positive to negative. This essentially applies frequency modulation (FM) to the RF signal. The magnitude of this frequency shift may, therefore, be determined by measuring the relative level of the vibration-induced sidebands and using FM modulation theory. The acceleration sensitivity or g-sensitivity of the oscillator is then found by using the known peak value of the vibration and normalizing the peak frequency shift to 1 g. Figure 1 shows the instantaneous frequency response of a crystal oscillator to a sinusoidal vibration profile and the frequency shift from positive to negative is evident.
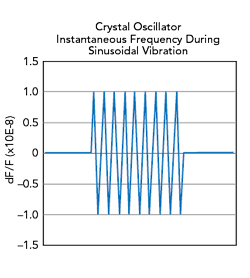
Figure 1 Crystal oscillator instantaneous frequency during sinusoidal vibration.
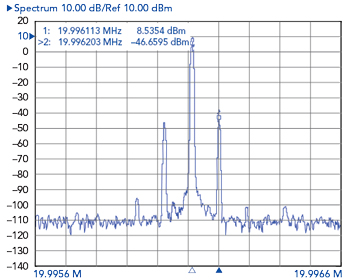
Figure 2 Sidebands generated in 20 MHz crystal oscillator.
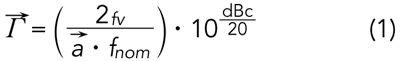
Figure 2 shows the spectrum of a 20 MHz crystal oscillator that is being vibrated at 90 Hz with a 10 g peak magnitude. Standard formulas show the conversion from the sideband level to the acceleration sensitivity or g-sensitivity, defined earlier as Γ. For a single-frequency vibration with the conditions described, Γ = 1.56 ppb/g. The derivation of this value is shown in Equation 1.
RANDOM VIBRATION
In most real-world applications, however, the vibration experienced is not a simple periodic force. Systems that operate on mobile platforms will experience random vibrational energy that is spread across the spectrum from less than 10 Hz to 10 kHz or higher. Instead of being defined by a discrete peak vibration level, the random vibration energy is spread over a specific bandwidth and is described by its power spectral density (PSD). The quantity is measured in g2/Hz, like a noise profile.

Figure 3 Phase noise versus frequency for 10 MHz SC-cut OCXO.
Each platform or vehicle will have a unique random vibration signature that will be used during validation and qualification testing. However, it is helpful to characterize oscillators using a flat, random profile over a specific bandwidth and observing the oscillator phase noise response. This can highlight mechanically resonant features in the assembly that may need to be addressed. It is possible to calculate the g-sensitivity from a random profile as well. But instead of using the peak value of vibration, the PSD is used.
Using the random profile approach, the formula in Equation 2 shows the calculation for phase noise using the PSD level at a specific offset or vibration frequency.
Figure 3 shows the phase noise of a very stable 10 MHz ovenized oscillator with an SC-cut crystal during random vibration. This illustrates that even though an oscillator may have a quiet noise profile when at rest, the phase noise is significantly degraded by more than 30 dB with a vibration level of only 0.05 g2/Hz. Figure 3 shows the results of the phase noise calculations from Equation 1, given the PSD level at a specific offset or vibration frequency when Γ = 0.07 ppb/g. It also points out the vector nature of the quartz, with different results depending on the direction of the applied force.