
A similar procedure is used to determine the dimensions of the other patches in the multi-bit tag.
CHIPLESS RFID DESIGN SIMULATION AND MEASUREMENT
Four-Bit Patch Tag
In the case of a multi-patch tag, an array of narrowband patches performs the functions of signal reception, tag-ID data encoding and transmission of backscattered signals. The individual patches each have a different resonant frequency and backscatter. A unique frequency signature is produced by the array in the total backscattered signal. The RCS of the tag presents the frequency signature encoding the tag-ID data.
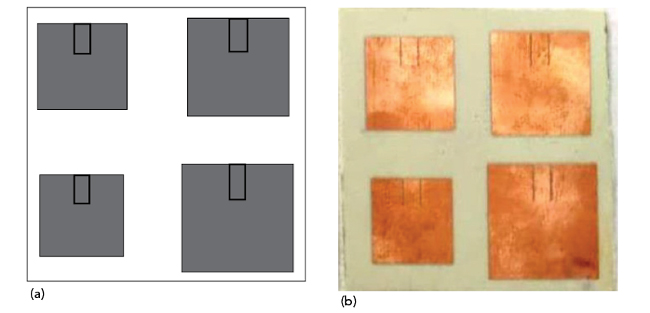
Figure 5 Layout (a) and manufactured (b) patch tags returning the ID 1111.
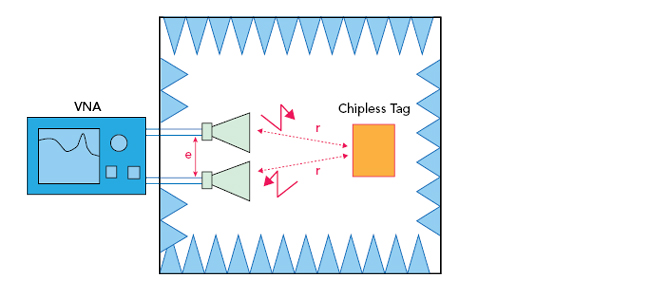
Figure 6 Measurement setup using a VNA in an anechoic chamber.
Two multi-patch tag designs are considered. The first is composed of four rectangular microstrip patch resonators. The four patch resonators have lengths Lp of 12, 13.5, 15 and 16.5 mm and resonate at 6.1, 5.7, 5.1 and 4.6 GHz, respectively (see Figure 5). Measurements are made in an anechoic chamber using a Keysight PNA-N5221A vector network analyzer (VNA) as shown in Figure 6. The horn antennas are separated by e = 30 cm. All resonant peaks up to r = 30 cm can be extracted. Simulated and measured results are shown in Figure 7.
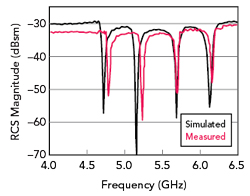
Figure 7 Simulated vs. measured RCS magnitude of the 4-bit chipless tag.
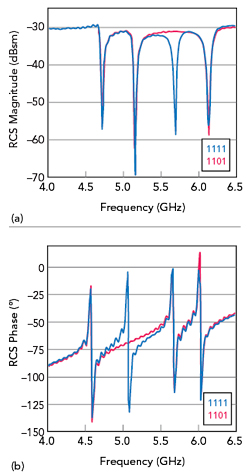
Figure 8 Simulated vs. measured RCS magnitudes (a) and phase (b) for two tags with different IDs.
One or more rectangular patches can be printed on a tag, and one or more of these patches can be shorted, nulling its corresponding frequency. A data bit 1 or 0 is encoded according to the presence or absence of a notch in the spectral response, respectively. Four notches appear in the magnitude response as four 1’s of the tag with ID “1111,” while three notches appear for three 1s, with no notch for the 0 in the magnitude response of the tag with ID “1101” (see Figure 8a). Four phase transitions are seen in the phase response for the tag with ID “1111,” but no phase transition appears in the 0 for the tag with ID “1011” (see Figure 8b).
Six Bit Patch Tag
Data capacity can be achieved by adding more resonators. Six resonators with Lp = 12, 13.5, 14.5, 15.5, 16.5 and 17.5 mm create six notches in the spectrum corresponding to six resonant frequencies at 6.1, 5.7, 5.4, 5.1, 4.7 and 4.4 GHz. The simulated and the manufactured structures are shown in Figure 9. Simulation and measurement results are shown in Figure 10. Six resonances are clearly detected and easily distinguishable and show good agreement between measurements and the simulation.
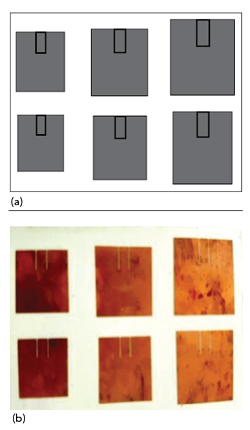
Figure 9 Layout (a) and manufactured (b) patch tags designed to return the ID 111111.
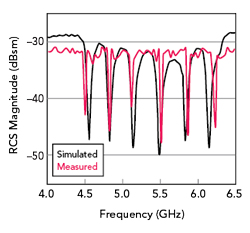
Figure 10 Simulated vs. measured RCS magnitude of the 6-bit chipless tag.
The theoretical RCS definition is independent of the distance (r) between the tag and the antenna.26 In practice, the measured quantity is the backscattered power received at the antenna, which is highly dependent on the measurement setup. The Agilent PNA-N5221A VNA in a bistatic configuration is used to measure vertically polarized radiation in the frequency domain. In the frequency range of 2 to 8 GHz, the VNA delivers 0 dBm of power. Over the frequency band of interest, the two horn antennas each have a gain of 12 dBi. In the setup shown in Figure 6, measurements are made with e = 30 cm and r = 20 and 30 cm. With r at 30 cm, the notch at the highest frequency is not well defined, which implies degraded performance beyond that range (see Figure 11).
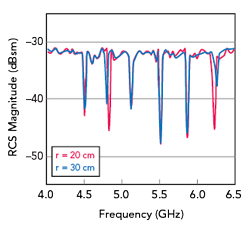
Figure 11 RCS magnitude of the 6-bit chipless tag placed at 20 and 30 mm from the transmit and receive horn antennas.
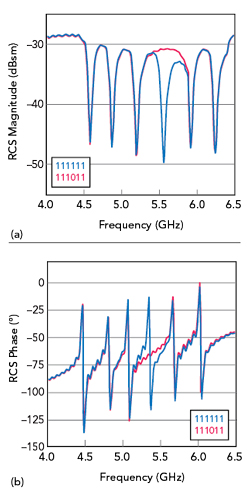
Figure 12 RCS magnitude (a) and phase (b) responses for tags with IDs of 111111 and 111011.
The chipless tag yields 6-bit data with a unique frequency signature. Comparing the results of the blue curve with those of the red curve in Figure 12a, the fourth notch disappears, creating a tag response with ID “111011.” Six phase transitions are seen in the phase response for the tag with ID “111111” in the blue curve, while only five are visible in the red curve in Figure 12b.