
The primary goal when measuring a device under test (DUT) is that its measured parameters are unaffected by ambient conditions and unwanted influences from the test setup. While environmental influences are easier to compensate or correct, more effort and know-how may be required with the test setup. This effort increases disproportionately with how precisely the DUT performance is to be determined.
In principle, test and measurement (T&M) setups are often similar. A signal source provides the input signal to the DUT, and the output is measured with a spectrum analyzer, network analyzer or power sensor. For a quick test of the DUT performance, it may be sufficient to simply use this setup and record the measurement; however, more precise data requires more effort. Under certain circumstances, for example, losses or full S-parameters from the test fixture must be considered, as well as the performance of the T&M instrument itself (e.g., phase noise, power supply noise).
In this article we examine the role of the signal source, showing that unwanted influences from an “unsuitable” signal source never yield useful results. Using measurement examples, we show the actual performance of the DUT can only be determined with a “suitable” signal source, i.e., with performance that ensures accurate measurement results that are not falsified by the T&M instrument. As examples, we have selected several components and three typical measurements: harmonics, compression and single sideband (SSB) phase noise (PN). In each example, the performance of the signal source is measured alone and its influence on the measurement result discussed. We refer to typical or measured performance to make it easier to understand how the actual performance of the DUT can be hidden by unwanted factors, such as insufficient harmonic suppression of the signal source.
HARMONIC MEASUREMENTS
When a single CW tone is applied to a nonlinear component such as a power amplifier (PA), unwanted signals will be generated at n multiples of the original frequency, n being the order of the harmonic. To illustrate how the signal source will affect the harmonic performance of a PA, we used two signal sources: 1) an analog RF and microwave signal generator with high harmonic suppression, the suitable signal source. The R&S SMA100B was used for these measurements. 2) An “unsuitable” source with harmonics greater than -30 dBc. The PA used for the measurements was a GaAs design covering 100 MHz to 7 GHz with 27 dBm saturated output power (Psat) and 7 to 8 dB gain.
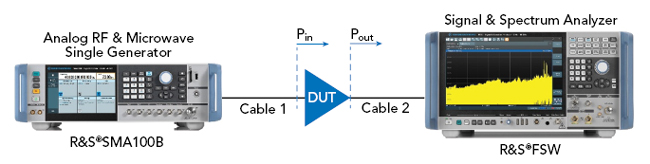
Figure 1 Test setup for measuring the second harmonic.
Figure 1 shows the test setup for the harmonic measurements, using an R&S FSW signal and spectrum analyzer to measure the second harmonic. The suitable and unsuitable signal sources were used to drive the PA, sweeping from 100 MHz to 7 GHz while keeping the output power (Pout) of the PA constant at approximately 7 dBm. The input power (Pin) was leveled to compensate for the cables and the frequency response of the PA.
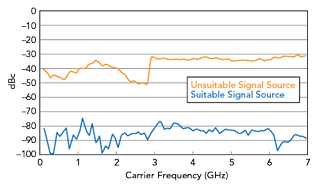
Figure 2 Second harmonic of the suitable and the unsuitable signal sources.
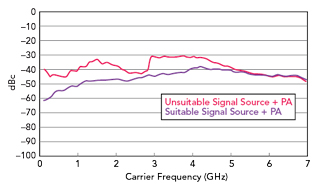
Figure 3 PA second harmonic measurements with the two signal sources.
The measured second harmonic performance of the two signal sources is plotted in Figure 2, showing a significant difference in harmonic suppression between the suitable and unsuitable sources. Inserting the PA and measuring the harmonic performance with each reveals how the harmonics from the unsuitable signal source make the apparent performance of the PA worse (see Figure 3). The effects of the harmonic performance of the signal sources is clearer by comparing the measurements of the individual sources with the combination in a single plot (see Figure 4), where the sweep is divided into four frequency ranges. Because the harmonic performance of the combination is the vector sum of the harmonics from the signal source and the PA, depending on the relative phase of the two signals, the combined performance is not simply the addition of the magnitudes of the two.
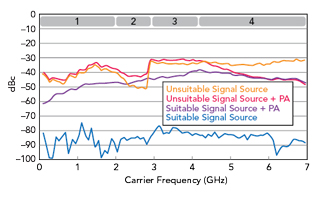
Figure 4 Comparing second harmonic measurements of the two signal sources and PAs driven by the respective sources.
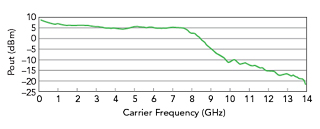
Figure 5 Measured PA frequency response.
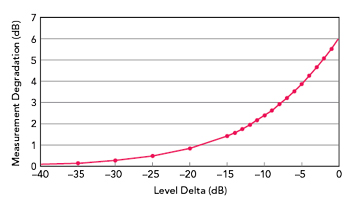
Figure 6 Measurement degradation caused by the second harmonic of the signal source.
In ranges 1 and 3, the measurement reflects the performance of the unsuitable signal source rather than the PA’s harmonics. In range 2, the measurement is closer to the PA’s actual performance because the performance of the unsuitable signal source is slightly better than the PA’s, so the contribution from the source is less. The interpretation of the measurement in range 4 is trickier. Why is the performance of the unsuitable signal source with the PA better than the source’s, when the opposite is expected? The PA’s frequency response provides the answer (see Figure 5). Above 8 GHz the gain drops; consequently, as the carrier frequency increases above 4 GHz, the second harmonic of the source is increasingly attenuated by the PA, and the measurement of the second harmonic from the combination gets closer to the PA’s actual performance.
The conclusion of the test: to avoid harmonic contributions from the signal source, a source with low harmonics should be used to prevent the source from “distorting” the PA measurement. Figure 6 quantifies how much better the signal source should be to obtain reliable measurements, assuming the worst case where the second harmonics of the signal source and the PA are in phase. For instance, if the second harmonic from the source is 30 dB below the PA’s actual performance, the second harmonic measurement of the PA will be degraded by approximately 0.3 dB, worst case.