

According to odd-even mode analysis, for high isolation the antenna port impedance must match the characteristic impedance and the port admittance value must be zero. Impedance matching is achieved with impedance matching transmission line sections, and the admittance adjustment is achieved with a T-type network. Formulas for the electrical length and characteristic impedance of the horizontal and vertical branches of the T-shaped network are:


Where Ye1 is the port admittance on the left side of the T-type network with even mode excitation, Yo1 is the port admittance on the left side of the T-shaped network with odd mode excitation, Ye0 is the even mode port admittance after adding the T-type network and Yo0 is the odd mode port admittance after adding the T-type network. The characteristic admittance of the horizontal branch is Yh and its electrical length is θh. The characteristic impedance of the vertical branch is Yv and its electrical length is θv.
From Equations (7 through 11) the length and width of each branch of the T-shaped network can be determined. Then the structure (see Figure 2b) is simulated and optimized (see Figure 3b). After impedance matching, isolation at 2.45 GHz is greatly improved; however, isolation at 5.8 GHz needs improvement and a shift in the high frequency resonance caused by the matching network must be corrected.
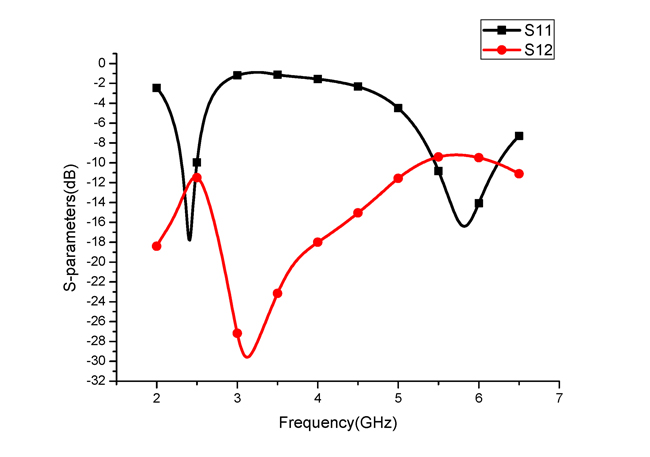
Figure 3a S-parameters of the original antenna.
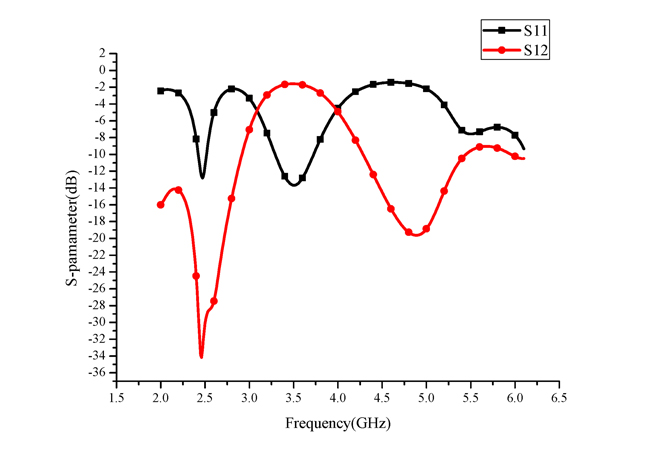
Figure 3b The antenna with a T-type decoupling network.
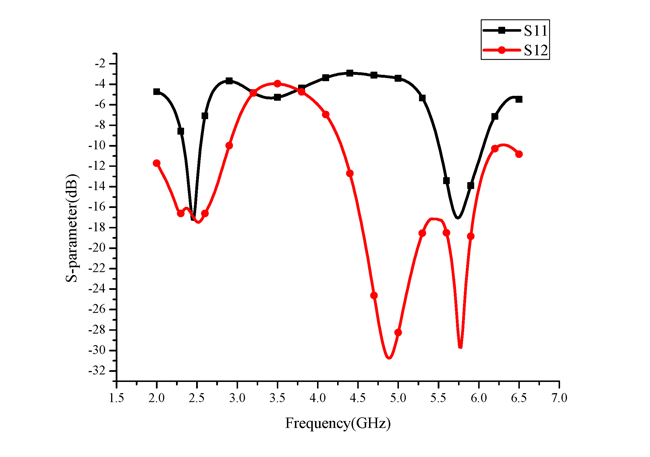
Figure 3c The antenna after adding a defected ground structure.
A decoupling structure is considered to improve isolation for the high frequency. Because some structures that can improve isolation, such as metamaterials, are designed on the upper surface of the dielectric substrate, which is likely to have a greater impact on the original decoupling network, a defected ground structure is chosen. For this work, an E-shaped defected ground structure is used, which has little effect on the lower frequencies, while greatly improving isolation at the higher frequencies. Due to the movement of the high frequency resonance, a section of impedance-matched microstrip transmission line is added as well, so that the antenna is well matched at 5.8 GHz. The completed antenna structure is shown in Figure 2c (front view) and 2d (back view), and its simulation is shown in Figure 3c. Surface currents obtained through simulation of the initial antenna and the decoupled antenna are shown in Figure 4.
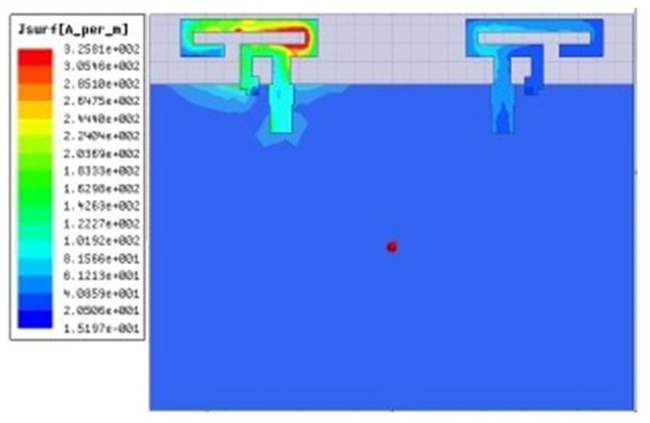
Figure 4a Surface currents in the original antenna and decoupled antennas: 2.45 GHz original antenna.
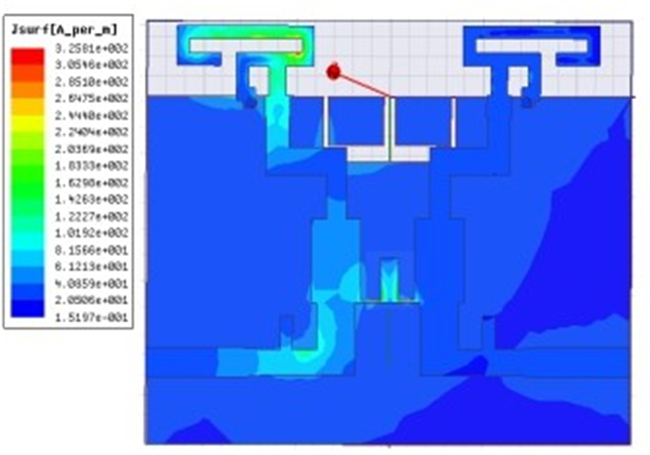
Figure 4b Surface currents in the original antenna and decoupled antennas: 2.45 GHz decoupled antenna.
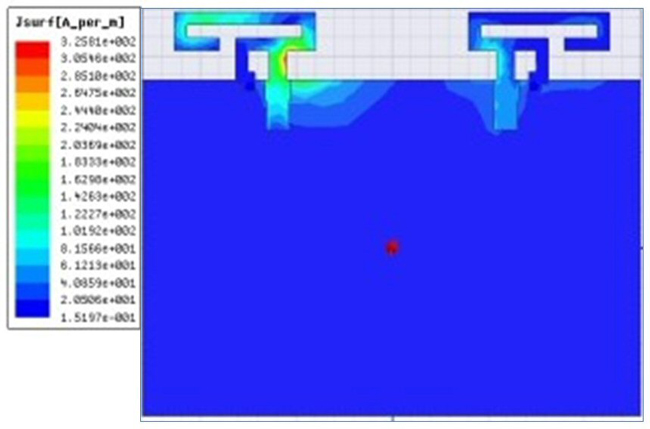
Figure 4c Surface currents in the original antenna and decoupled antennas: 5.8 GHz original antenna.
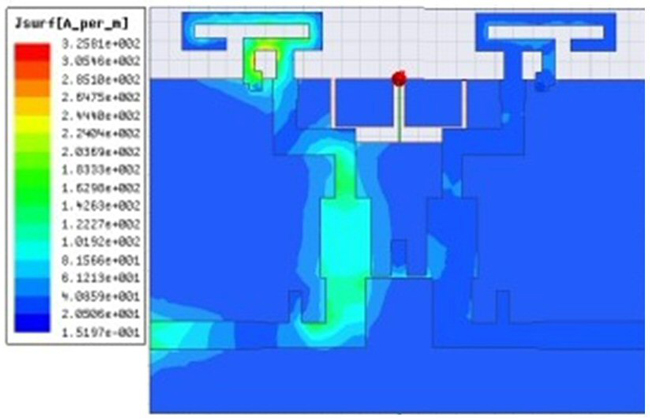
Figure 4d Surface currents in the original antenna and decoupled antennas: 5.8 GHz decoupled antenna.
There is significant interaction between the original antenna ports, but after adding the decoupling structure, a new coupling path is added. The non-excited part and the decoupling structure form a new current direction that is opposite to the original coupling current direction, thereby canceling the coupling current on the surface of the non-excited unit and improving isolation.
EXPERIMENTAL VERIFICATION
The Fabricated antenna is shown in Figure 5. S-parameters are obtained with a vector network analyzer (see Figure 6) and are consistent with simulation. With the two decoupling structures, S12 at 2.45 GHz is reduced from –10 dB to –19 dB and S12 at 5.8 GHz is reduced from –10 dB to –23 dB (see Figure 7). Envelope correlation coefficients of the antenna are less than 0.01 in both the low frequency and high frequency bands, which meets the MIMO antenna design requirements. Measured radiation patterns of the MIMO antenna at the two operating frequencies are shown in Figure 8.