
VNA
The receivers in the VNA tend to deviate from linear behavior at high input power levels. Nonlinearity is essentially a systematic error that can be corrected using an appropriate nonlinear model. Since the nonlinear behavior may be different for each receiver and modeling each is impractical, the non-linearity is approximated with a linear model, denoted as L in Figure 6b.
Noise is a random error and encompasses unpredictable fluctuations in the indications of the VNA. The noise influence is divided into the noise floor (NL) and trace noise (NH), where the noise floor is observed without any source signal, and the trace noise scales with the applied source signal level.
Drift accounts for changes in the performance of the entire measurement system over time, due to thermal and other environmental effects. A simple model associates a drift value (D00, D11, D01) to each error term, as shown in Figure 6b.
Calibration Standards
The calibration standards need to be characterized, including their associated uncertainties (shown as block S in Figure 5). Depending on the level of accuracy required, this can be obtained from the manufacturer, a calibration laboratory or a national metrology institute, with the characterization traceable to SI units.10 It has been demonstrated that coaxial calibration standards can be characterized more accurately and more consistently by including the effects of the connectors in the characterization.11 When performing the VNA calibration to estimate the error coefficients, these uncertainties are propagated together with the other contributions to the error coefficients.
Once all the sources of error and influences are modeled and estimated, VNA calibration and error correction can be performed. Uncertainty contributions are propagated through the full measurement model to the measurement results. This will be sufficient to have confidence in the measurement if the following conditions are met:
- All sources of significant errors and influences are included in the models (see the error models described previously).
- The sources are estimated realistically, i.e., these errors are characterized based on the real measurement conditions; in some cases, supplier specifications may not be sufficient.
- The calibration standards are characterized accurately with realistic uncertainties.
The first condition is usually satisfied for most measurement setups. The second depends mostly on the operator estimating the uncertainties, and the third depends on the source characterizing the standards.
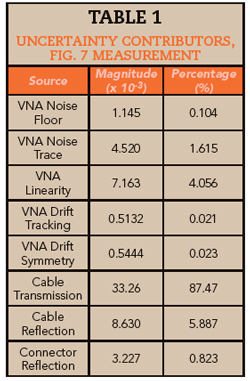
Using this approach will enable engineers to determine an uncertainty budget and the major contributions to the overall uncertainty. This is a powerful tool because it shows where to improve system accuracy if the uncertainty is too high. To illustrate, in the amplifier measurement (see Figure 7 and Table 1), cable stability and connector repeatability represent more than 90 percent of the total uncertainty.
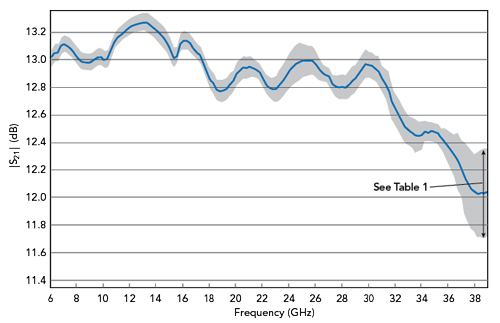
Figure 7 Total amplifier gain measurement uncertainty, calculated using Maury MW Insight software.
Verification and Validation Tool
Several methods and techniques are used to validate a calibration. Some use T-checkers or Beatty standards, others use pre-characterized verification standards. The quality of a calibration can be “bad” due to sources of error, such as mixing standards, damaged standards and cables, loose connections or sudden noise in the system due to environmental changes. Since these significant sources of error are usually not accounted for in the characterization of the uncertainty contributors, they will not be considered in the uncertainty budget, which will degrade the quality of the calibration and, hence, measurement accuracy.
This section addresses verification devices, because they enable the validation of the calibration accuracy and estimate the level of precision achievable. Verification per the International Vocabulary of Metrology (VIM) definition12 provides objective evidence that the calibration fulfills specified requirements; however, as these requirements can be specified quite arbitrarily, more important than the verification is the validation13, which is the verification whose specified requirements are adequate for measuring the devices intended for measurement.
Most of the current verification devices are not characterized with uncertainties, and it is difficult for the user to specify an adequate requirement for the validation. In most cases, the user compares the reference characterization with the actual measurement and estimates how close the two are. This is quite subjective, as shown in Figure 8a, which shows a difference in magnitude; the question is whether this is sufficient. Had the results included uncertainties, the user could proceed more systematically and quantitatively as follows:
- Choose a verification standard which has been previously characterized with uncertainties and is representative of the measurement. For example, a fixed load different than one used as a calibration standard can be selected for a one-port, low reflection measurement.
- Validate that the uncertainties of the setup are not too large by 1) comparing the setup uncertainty with the uncertainty provided by the manufacturer of the verification device; 2) comparing the setup uncertainty at the 95 percent confidence level with the design tolerance of the DUT. The expanded uncertainty for the 95 percent confidence interval should always be smaller than the design tolerance; and 3) if the uncertainties do not satisfy the above two conditions, re-evaluate the VNA, cable, connector and the calibration kit used for the calibration.
- A normalized error can be used to finalize the validation,7 where the scalar version is defined by:
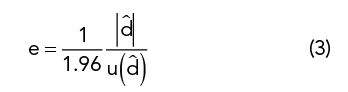
Where dˆ is the estimate of the difference between the measurement and verification device and u(dˆ) is the estimate of the standard uncertainty of the difference. The factor 1.96 corresponds to a 95 percent coverage condition, which is quite common in conformity assessment. Figure 8b shows the uncertainties of the same amplifier measurement from Figure 8a. Areas of insufficient overlap of the two uncertainties result in values of e>1 and indicate a failed verification.
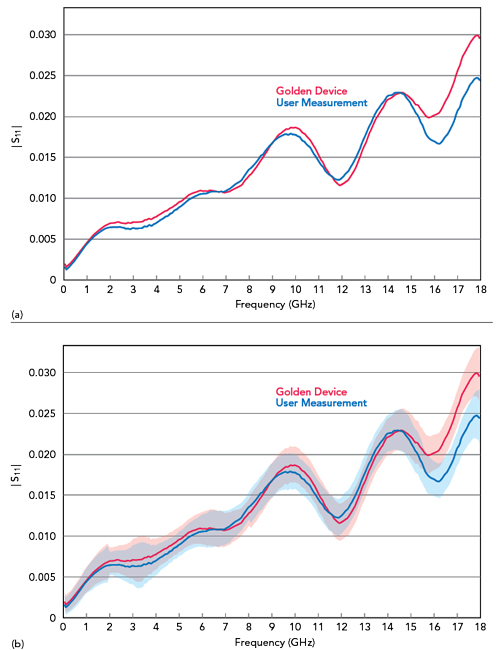
Figure 8 Comparison of “golden” device and user measurements (a); same data showing measurement uncertainty (b).
Conclusion
As technologies evolve and requirements become more challenging, implementing processes that increase confidence in measurements and ensure accurate and reliable characterization - and product performance - are critical. Characterizing and quantifying measurement uncertainty is one such process to achieve the desired results. Uncertainty can aid in definitively verifying a VNA calibration before measuring a DUT. Uncertainty can help understanding how the various components in a measurement system impact the overall uncertainty of the DUT measurement. Identifying, quantifying and reducing the major sources of uncertainty in a test setup will improve the accuracy of the overall measurement. Referring to the original amplifier scenario shown in Figure 1, quantifying measurement uncertainty can provide the confidence that the true performance of the DUT is reflected in the measurements, and the design will not pass one test and fail another.
References
- Clause 2.17, “VIM: International Vocabulary of Metrology, Third Edition,” JCGM 200:2012, www.bipm.org/en/publications/guides/vim.html.
- Clause 2.19, “VIM: International Vocabulary of Metrology, Third Edition,” JCGM 200:2012, www.bipm.org/en/publications/guides/vim.html.
- Clause 2.48, “VIM: International Vocabulary of Metrology, Third Edition,” JCGM 200:2012, www.bipm.org/en/publications/guides/vim.html.
- Evaluation of Measurement Data, “Guide to the Expression of Uncertainty in Measurement,” JCGM 100:2008, www.bipm.org/en/publications/guides/gum.html.
- M. Hiebel, “Fundamentals of Vector Network Analysis,” Rohde & Schwarz, 2007.
- J. P. Dunsmore, “Handbook of Microwave Component Measurements,” 2014.
- M. Zeier, D. Allal and R. Judaschke, “Guidelines on the Evaluation of Vector Network Analyzers (VNA), EURAMET Calibration Guide, No. 12, Version 3, 2018, www.euramet.org/publications-media-centre/calibration-guidelines/.
- “Improving Calibration Accuracy and Speed with Characterized Calibration Standards,” Maury Microwave App Note 5C-090.
- M. Zeier, J. Hoffmann, J. Ruefenacht and M. Wollensack, “Contemporary Evaluation of Measurement Uncertainties in Vector Network Analysis,” Cal Lab Magazine, October–December 2018, pp. 22–31, www.callabmag.com/contemporary-evaluation-of-measurement-uncertainties-in-vector-network-analysis/.
- Clause 2.41, “VIM: International Vocabulary of Metrology, Third Edition,” JCGM 200:2012, www.bipm.org/en/publications/guides/vim.html.
- M. Zeier, J. Hoffmann, P. Hürlimann, J. Rüfenacht, D. Stalder and M. Wollensack, “Establishing Traceability for the Measurement of Scattering Parameters in Coaxial Line Systems,” Metrologia 55, January 2018, S23–S36.
- Clause 2.44, “VIM: International Vocabulary of Metrology, Third Edition,” JCGM 200:2012, www.bipm.org/en/publications/guides/vim.html.
- Clause 2.45, “VIM: International Vocabulary of Metrology, Third Edition,” JCGM 200:2012, www.bipm.org/en/publications/guides/vim.html.