
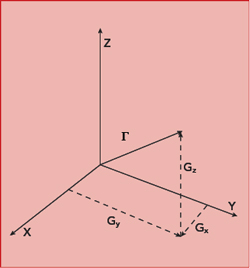
Figure 1 G-sensitivity is a vector and depends on the direction of the applied acceleration.
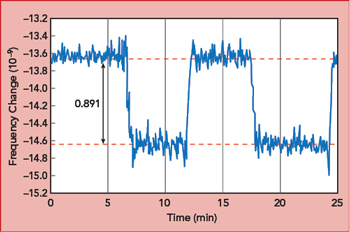
Figure 2 G-sensitivity measurement for one axis using the tipover method.
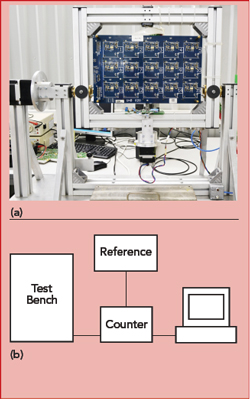
Figure 3 Automated 2g tipover test bench for measuring 15 oscillators (a) and block diagram (b).
Frequency stability is the key requirement for quartz oscillators. It determines the accuracy and resolution sensitivity of radar and radio navigation systems, the measurement error of measuring systems and the quality and reliability of communications systems. Frequency stability depends on many parameters including the acceleration forces applied to the crystal oscillator, which can be constant acceleration, vibration, shock, displacement, inclination or rotation. This article discusses how acceleration impacts frequency stability.
The frequency stability of crystal oscillators depends on a number of parameters, including the impact of acceleration or vibration. These are critical for some applications, such as an oscillator operating on a mobile platform. This frequency stability is commonly referred to as crystal oscillator g-sensitivity. It is defined as the relative change of the oscillator’s output frequency under 1g (~9.8 m/s) acceleration, and it may vary from 10-8 to 10-11 per 1g.
G-sensitivity is a vector, depending on the direction relative to three mutually perpendicular crystal oscillator axes, not only on the magnitude of the acceleration.1 The greatest shift in oscillator frequency occurs when the applied acceleration is parallel to the g-sensitivity vector. The magnitude and direction of the g-sensitivity vector, Γ, is determined by measuring the separate, mutually-orthogonal components within the x, y and z axes (see Figure 1).
2g TIPOVER TEST
The easiest way to measure crystal oscillator g-sensitivity along one of the axes (Gx, Gy or Gz) is to measure the frequency change caused by turning the oscillator with respect to one axis, the so-called 2g tipover test. The frequency is measured immediately before and after the rotation. The acceleration changes by 2g during this rotation, so the measured oscillator frequency shift must be divided by two to obtain the g-sensitivity along the axis. To calculate the g-sensitivity vector, similar measurements must be performed for all three axes.2 Then, the magnitude of the g-sensitivity will be
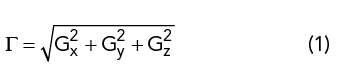
Figure 2 shows an example of the frequency shift during several rotations around one axis. The measured shift is 0.89 x 10⁻⁹, so the g-sensitivity along this axis is 0.45 x 10⁻⁹. Measuring the other two axes, the g-sensitivity results are 0.3 x 10⁻⁹ and 0.21 x 10⁻⁹, yielding the g-sensitivity vector, Γ = 0.58 x 10⁻⁹/ g.
The simplicity of the 2g tipover method is a great advantage - such measurement can be performed on a table without any additional instruments. Figure 3 shows the view of the automatic test bench used to perform 2g tipover test. This test bench ensures automatic rotation around each of three oscillator axes and frequency counting immediately before and after rotation. Moreover, the test bench can accommodate 15 crystal oscillators simultaneously.
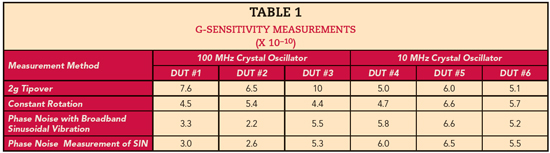
However, this method is best used to measure the g-sensitivity of oscillators with good frequency vs. temperature stability; in this case, the measurement results agree with other methods (see Table 1). Unfortunately, the method is not universal, as oscillators with poor frequency vs. temperature stability have additional frequency shifts caused by temperature variation due to convection of the air in the oscillator.
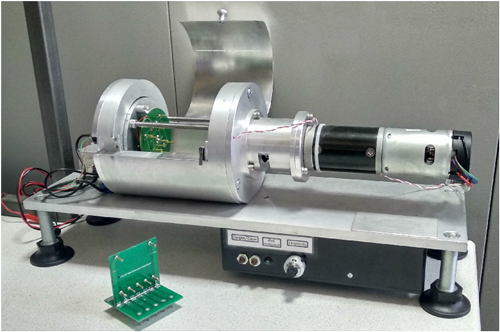
Figure 4 An automated test bench for measuring the g-sensitivity during constant rotation.