
CONSTANT ROTATION
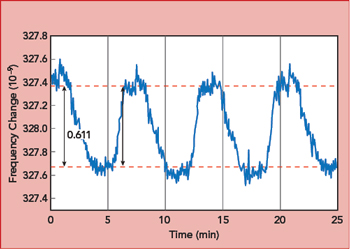
Figure 5 G-sensitivity measurement with constant rotation of the oscillator.
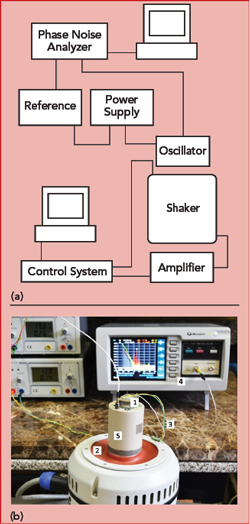
Figure 6 Test setup block diagram (a) and bench for measuring oscillator phase noise under vibration.
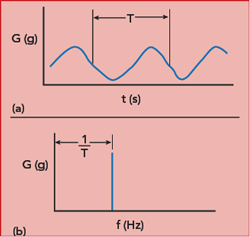
Figure 7 Sinusoidal vibration (a) generates sidebands in the oscillator signal at the vibration frequency (b).
Measurement while the oscillator is constantly rotating is another way to determine g-sensitivity. With constant rotation, the temperature is evenly distributed inside the oscillator, enabling more accurate assessment of acceleration. Figure 4 shows a test bench to perform this type of test. The oscillator is placed inside the cylinder, and the oscillator frequency is measured with a frequency counter during rotation, which measures the g-sensitivity for two axes at once. The test system enables the rotation rate to be varied. During rotation, the oscillator’s frequency change is sinusoidal (see Figure 5).
With this test method, calculating the g-sensitivity is more complicated and the results are less apparent, since each rotation changes the acceleration along two axes. Also, a very short time for the frequency count at a high rotation rate may cause significant measurement error.
The 2g tipover and constant rotation tests are only suitable for measuring low frequency oscillators, i.e., 30 MHz and below, with good frequency vs. temperature stability.
INDIRECT MEASUREMENTS
Another approach to measuring g-sensitivity is an indirect method, calculating the sensitivity from the degradation in oscillator phase noise under vibration. As previously stated, an acceleration force applied to an oscillator causes a frequency shift (Δf) proportional to the acceleration and dependent on the direction. It is calculated as

where f0 is the frequency of the oscillator without vibration, α is the applied acceleration, Γ is the g-sensitivity vector and y the frequency shift.3 Using this method, errors may be caused by noise in the signal path, not the oscillator’s g-sensitivity.
A test setup for measuring phase noise under vibration is shown in Figure 6. The crystal oscillator (1) is placed on a vibrating plate (2) and exposed to sinusoidal or broadband vibration, defined before the start of the test. Test parameters include vibration amplitude and frequency or the frequency band for broadband vibration. The coaxial cables (3) connecting the oscillator on the vibrating plate with the measuring system (4) must be securely fixed to ensure no additional phase variation. A special fixture made of ZEDEX engineering plastic (5) attaches the oscillator on the vibrating plate to avoid magnetic fields from influencing the test at low frequencies.
Under sinusoidal vibration, additional sidebands appear in the signal spectrum at the vibration frequency, and the level can be measured by a spectrum or phase noise analyzer (see Figure 7). The g-sensitivity along one of the crystal oscillator axes is calculated by

where A is the peak value of the acceleration, fv is the vibration frequency and L(fv) is the level of the phase noise at the vibration frequency.3
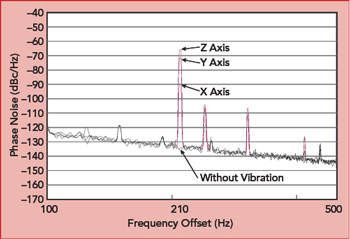
Figure 8 100 MHz oscillator phase noise under 210 Hz sinusoidal vibration.
Figure 8 shows a phase noise measurement of a 100 MHz oscillator under sinusoidal vibration at 210 Hz and 5g amplitude. The g-sensitivity is calculated measuring the phase noise for each axis during vibration and then calculating the overall magnitude:
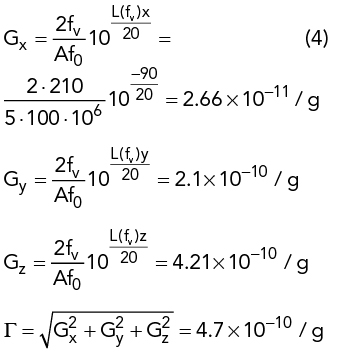
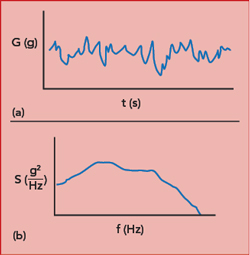
Figure 9 Broadband sinusoidal vibration (a) creates a spectral power density of randomly distributed frequency, phase and amplitude (b).
Broadband sinusoidal vibration can also be used to evaluate g-sensitivity. In this case, the vibration is randomly distributed over frequency, phase and amplitude (see Figure 9), with the acceleration described as a spectral power density Sa(f).4 The impact of random vibration on the oscillator’s phase noise is calculated from

and the g-sensitivity is calculated from

where Sa(f) is the spectral power density of the random acceleration (g2/Hz).3
Figure 10 shows the degradation of a 100 MHz oscillator’s phase noise performance under broadband sinusoidal vibration from 50 to 200 Hz and a root-mean-square spectral power density 0.17 G2/Hz.
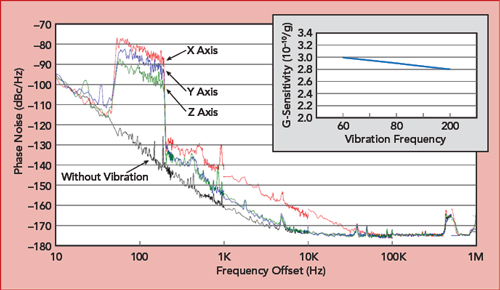
Figure 10 Oscillator phase noises under broadband sinusoidal vibration from 50 to 200 Hz with a root-mean-square spectral power density 0.17 G2/Hz.
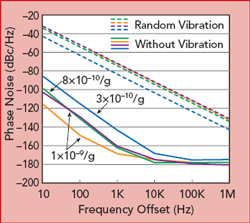
Figure 11 Oscillator phase noise comparing performance with no vibration and random vibration.
The level of phase noise under vibration depends on the oscillator’s g-sensitivity and applied vibration - not on the phase noise of the crystal oscillator itself. To see this, refer to Figure 11, which compares the measured phase noise of four 100 MHz oscillators with random vibration and without vibration. Two of the oscillators, shown by the purple and orange plots, have considerably different phase noise
(−129 and −149 dBc/Hz at 100 Hz offset, respectively) yet the same g-sensitivity (1 x 10⁻⁹/g with 6g amplitude vibration) and phase noise under vibration (−52 dBc/Hz at 100 Hz). The oscillator with a better g-sensitivity of 3 x 10⁻¹⁰/g (blue curve) has a phase noise under vibration of −63 dBc/Hz at 100 Hz offset - also better. Comparing oscillators under vibration, the level of phase noise of the crystal oscillator with the lower g-sensitivity is lower than the phase noise of the oscillators with high g-sensitivity.
SUMMARY
Table 1 compares the results of several oscillator measurements by the methods described in this article. For 10 MHz oscillators, the results from all the methods are similar, while the results of the 2g tipover test for 100 MHz crystal oscillators show greater values than the indirect measurement methods derived from the phase noise. The g-sensitivity measurement with sinusoidal vibration is less susceptible to thermal processes such as air convection, and this method provides the most accurate evaluation of oscillator g-sensitivity.
References
- S. Fry, “Acceleration Sensitivity Characteristics of Quartz Crystal Oscillators,” GreenRay Industries Inc., 2006.
- R. L. Filler, “The Acceleration Sensitivity of Quartz Crystal Oscillators: A Review,” IEEE Transactions on Ultrasonics, Ferroelectrics and Frequency Control, Vol. 35, No. 3, May 1998.
- J. R. Vig, “Quartz Crystal Resonators And Oscillators: A Tutorial,” U.S. Army Communications-Electronics Research, Development & Engineering Center, Fort Monmouth, N.J., March 2004.
- A. Hati, “PM Noise of Oscillators and Components in the Presence of Vibration,” NIST, 2009.