
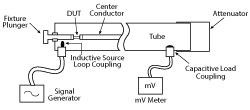
Figure 1 Resonant tube.
There are many different types of capacitors with many different parameters; each is suited to a range of applications. As operational frequency requirements increase, electronic systems downsize and power usage becomes more critical, the most important parameters are quality factor (Q) and equivalent series resistance (ESR). Measurement and characterization of multi-layer ceramic capacitors (MLCC) for these parameters is demanding, and with limited standardization of test methods, comparison of ranges or competitors is difficult.
In this article, Knowles addresses the measurement of ESR in high Q MLCCs, probably the most requested parameter, describing the test methods in use and how Knowles measures the data published in the company’s datasheets.
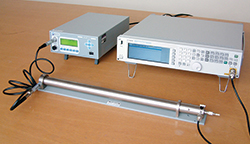
Figure 2 Boonton 34A with traditional setup.
Q, ESR, POWER
Q is the quality factor, the reciprocal of the dissipation factor (DF), and represents the losses of the capacitor.
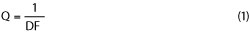
The higher the Q, the lower the DF and the lower the loss. ESR is the equivalent series resistance (RS), representing the effective resistance to RF current. ESR encompasses the loss properties of both the dielectric and electrode.
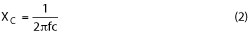
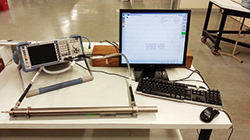
Figure 3 Boonton 34A with VNA setup.
where f is frequency (Hz), C the capacitance (F) and XC the capacitive reactance (Ω). Then,

The power dissipated in the capacitor (W) is given by

where I is the RMS current flowing in the capacitor (A).
Knowing the value of ESR is important because it determines the suitability of the component for use in RF power applications. If the ESR value is too high, the self-heating due to I2 R losses will be too great, and the part will overheat and fail. The ESR also enables the maximum current rating for the component to be calculated.
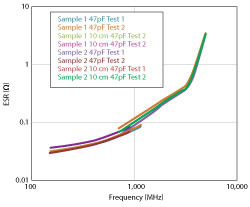
Figure 4 47 pF capacitor measurements using Boonton 34A and 10 cm tube.
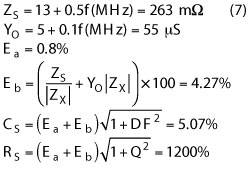
As an example, consider a cellular phone base station operating in the GSM900 band at 940 MHz. A high Q, 47 pF capacitor, with an ESR of approximately 0.088 Ω at 940 MHz, is used as the coupling capacitor in this 50 Ω system. The RF power incident on the capacitor is 40 W. Using P= I2 R, where R = Z + ESR, to find the circuit current gives 0.89 A. To find the power dissipated in the capacitor, we put this value of current back into P= I2 R, where R = ESR, which gives 70 mW. The power dissipated in the capacitor is simply derived from the ratio of the ESR to the total circuit impedance multiplied by the system power:
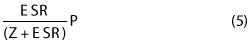
For values of ESR significantly lower than the Z value, there is a negligible change to the overall circuit impedance; it can be ignored, leaving
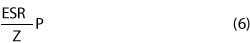
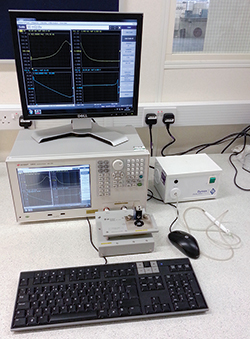
Figure 5 Keysight E4991B with jig.
Using the same calculations for a 47 pF, ultra-low ESR capacitor, with ESR = 0.07 Ω at 940 MHz, the power dissipated in the capacitor is 56 mW, a 20 percent reduction. This capacitor allows the system to either run cooler or at higher power.
Different dielectric and electrode combinations will exhibit different levels of Q and ESR. At lower frequencies, the dielectric material is the dominant factor; metal losses become more important at higher frequencies. X7R materials are used at low frequencies and typically have a DF of around 1 to 2 percent, measured at 1 kHz, which corresponds to a Q of 50 to 100. C0G/NP0 materials have Qs between 600 to 1000, measured at 1 MHz.
Under laboratory conditions, measurement of Q at 1 MHz can show higher Q values, 10,000 or greater. However, for practical purposes, the limit for 100 percent testing on high speed machines is ~2000. 100 percent measurement of Q is not practical above 1 MHz. Capacitance bridges and LCR meters are not accurate enough and, when combined with leads and contacts, rapid high frequency measurement is not possible. It is necessary, though, to assess the Q and ESR near the operating frequency. However, this risks test variance and accuracy issues which can cause problems interpreting the data.
ESR MEASUREMENT
Two measurement methods are commonly used to determine Q and ESR: a coaxial resonant tube, a swept impedance analyzer or a combination of the two. Each will be discussed.
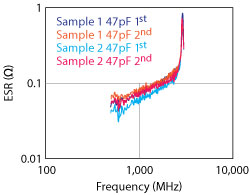
Figure 6 47 pF capacitor measurements using Keysight E4991.
Coaxial Resonant Tube Measurement
The most accurate method of determining Q and ESR at “high” frequencies, i.e., from approximately 100 MHz to 1.2 GHz, is with a resonant line coaxial jig. The industry standard tube for doing this was developed many years ago as the Boonton model 34A, manufactured by the Boonton Electronics Corp., and designed to be used with an RF millivolt meter and a signal generator (see Figures 1 and 2).
Using this historic setup, the
![]()
resonant frequencies are measured by adjusting the signal generator until the peak reading is recorded on the millivolt meter. For each resonant frequency, the 3 dB bandwidth is determined by adjusting the frequency until the meter reading drops to 50 percent of the resonant value. The tube is characterized by measuring the

frequencies and bandwidths with both open and short circuits. Then the capacitor chip is inserted between the two conductors and held by the shorting plunger. From a full set of measurements, the ESR and Q can be calculated at the resonant frequencies. With data at three, four or five frequencies, ESR vs. frequency is plotted and a “best fit” line is drawn between them. The response curve between resonances is assumed to be relatively linear.
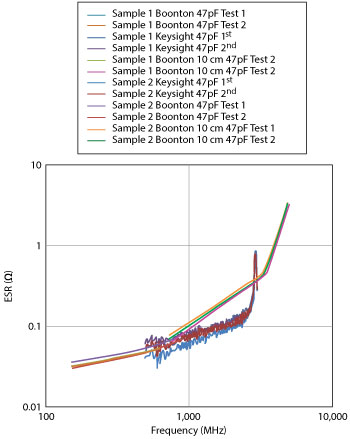
Figure 7 Comparison of Boonton and Keysight measurements.
The Boonton resonant tube system was developed before the advent of VNAs. Today, it is common to replace the signal generator and millivolt meter with a VNA (see Figure 3). With the resonances visible as graphical peaks, the frequency and bandwidth can easily be read. Modern VNA equipment allows the data to be directly exported to the calculation program.
The resonant tube method remains the only relatively accurate way of measuring ESR and Q of small MLCCs. This was recognized when the international standard for ESR measurement, EIA-RS-483, was written, as it specifies using this equipment. However, there are limitations to this measurement method. The operating frequency range of the tube is limited by physical length to a frequency range from approximately 100 MHz to 1.25 GHz. EIA-RS-483 reflects this, as it only covers ESR measurements in that range. It can also be seen in the data published by some MLCC manufacturers that provide data between 1 and 1.5 GHz. To use a resonant tube to measure at frequencies outside this standard range, a new tube must be manufactured and characterized. Boonton made the only commercially available tube in the 34A; any other tube will be “homemade,” and the build quality and characterization may not be as good as the Boonton.
Resonances within the capacitor may cause problems and must be considered. The ESR response of an MLCC is not linear, peaking at the parallel resonant frequencies (PRF), where the capacitor response is erratic. If the resonances of the tube are close to a MLCC PRF peak, then the measurements need to be ignored. As the tube does not show the PRF of the MLCC, it takes an experienced operator to identify which measurements must be eliminated from the curve. As an example, consider a 47 pF MLCC measured using two resonant tubes: 1) measurements to 1.2 GHz using a Boonton 34A and 2) measurements from 700 MHz to 5 GHz using a homemade 10 cm resonant tube (see Figure 4). Notice the severe change in response between the two tubes and the elevated readings in the GHz region. This MLCC had a PRF around 2.6 GHz and a second-level resonance around 5 GHz, rendering the measurements from the smaller tube irrelevant much beyond the 1.3 GHz data obtained with the Boonton 34A.
Swept Impedance Analyzer Measurement
Given the limitations of the coaxial resonant tube measurement, it’s desired to have an alternative to measure ESR. A swept frequency method takes more measurements across frequency and gives a better understanding of the performance of the component.
It is possible to take reasonably accurate readings by soldering parts to boards, measuring the response using a VNA to generate S-parameters, then reverse modeling to determine the ESR. While this is not as accurate as the resonant tube — it is vital to carefully compensate out the test board — it does have the advantage of producing a swept response highlighting any resonances in the system. (The problem with the accuracy of swept measurements used in isolation will be discussed later.)
For ease of testing, it is preferable to use test equipment that allows the device under test (DUT) to be placed directly into a test fixture of known characteristics and measured directly. One example of such equipment is the Keysight E4991 impedance analyzer (see Figure 5), which is essentially a VNA with a modified front-end interface that allows direct measurement of the ESR, Q, Z and C of an MLCC. It performs a swept measurement up to a maximum of 3 GHz. This is now becoming recognized as the standard method for characterizing MLCCs, increasingly being adopted by the manufacturers and users of these capacitors. Various jigs are available to measue different chip sizes.
However, this method has a limit that is important to recognize. Analyzing the accuracy of the measurement, as shown in Keysight’s documentation, it becomes clear that measurement of the very small ESR of MLCCs is difficult. The errors and uncertainties are best shown with an example of the accuracy when measuring a 51 pF MLCC at 500 MHz, where Zx = 6.153 Ω, Rs = 0.026 Ω, DF = 0.00423 and Q ≈ 250. Applying the accuracy calculation from Keysight’s datasheet for the E4991A yields:
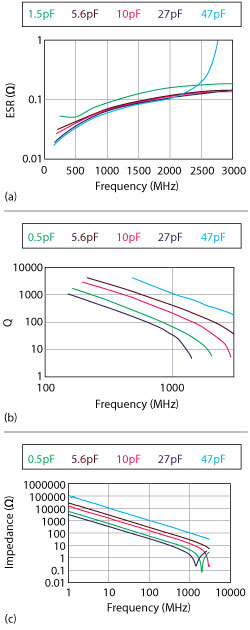
Figure 8 ESR (a) Q (b) and impedance (c) measurements, combining the Boonton 34A and Keysight E4991B analyzer with 16197A test fixture.
Thus, the uncertainty is RS= 0.026 ± 0.312 Ω.
Note that this calculation does not include the accuracy and uncertainty of the test fixture. Assuming the MLCCs are tested using Keysight’s 16197A test fixture, the calculated accuracy is
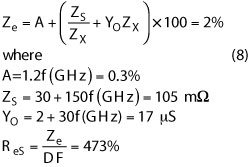
Here, the uncertainty is ReS=0.026 ±0.123 Ω. The combined accuracy and uncertainty is given from:
or RS= 0.026 ± 0.335 Ω.
The accuracy of this test method is not very suitable in isolation. The curves it produces, however, do include the PRF resonances and are much more useful in determining the actual performance of the component. Figure 6 shows the E4991 measured data of the 47 pF MLCC previously measured with the resonant tube. Overlaying the two sets of data (see Figure 7), we can see exactly how the resonant tube measurements are being affected by the PRF resonances and how inaccurate a resonant tube measurement and a swept measurement can be in isolation.
Combining the Boonton and Swept Measurements
Comparing the Boonton and swept measurement methods, both produce results that have accepted inaccuracies. Neither test method can be used in isolation; however, combining them enables cross checking the results and confirming that the readings taken are reasonably accurate. As such, the procedure adopted by Knowles is to:
- Measure the component using the Boonton 34A, generally following EIA-RS-483 and with a maximum frequency of 1.2 GHz
- Use the results of the Boonton test to verify the setup of the Keysight E4991, to demonstrate that the calibration is as accurate as possible
- Perform swept measurements on the Keysight E4991
- Combine both sets of readings.
Using this method, plots are generated for ESR, Q and Z (see Figure 8).
TEST JIG VARIATION
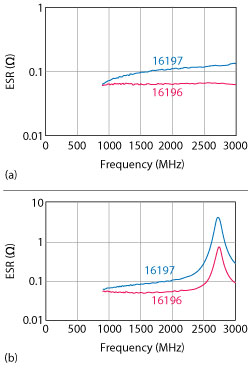
Figure 9 Comparison of 18 pF (a) and 56 pF (b) capacitor ESR measurements using two test jigs.
In defining the Knowles test regime, all data on MLCC chip sizes 0603 to 1206 is measured using the Keysight 16197 surface-mount fixture. An alternative fixture, the Keysight 16196, may also be used for testing. It has a range of jigs tailored to specific MLCC sizes, from 0603 and smaller. The major difference between the 16196 and 16197 jigs is the connection to the MLCC: the 16196 only contacts the end of the chip, while 16197 contacts the bottom pad of the termination. Neither connection is truly representative of an MLCC soldered on a board, but they do allow comparison testing of different MLCCs. It is not unusual to achieve different test results from the same component tested on the 16196 and 16197 jigs (see Figure 9). So when making comparisons, the performance should be measured on the same type of fixture.
CONCLUSION
ESR and its associated data (i.e., Q and Z) are important considerations for circuit design, yet notoriously hard to measure. It’s equally hard to compare data supplied from different companies or measure and verify supplier data. The difficulties and inaccuracy associated with these measurements mean that these parameters are always given as “typical” data. MLCCs are defined by the capacitance and working voltage. Good control of materials and design mean that the performance will be consistent, although actual measured data may vary.
ESR is best considered as a comparative measurement, meaning measuring components on the same system on the same day with the same compensation set will provide a good indication of relative performance. Comparison with data obtained from other sources or tested at other times may not give a true picture of how the parts will perform in the circuit. Even when considering comparison test data, remember that it is obtained from a component mounted in a test fixture and may not be totally representative of a component soldered into a circuit. Suitability of operation must always be confirmed by evaluation in the actual circuit. ESR, Q and Z plots are therefore supplied with the aim of giving an indication of the performance of an MLCC over a given frequency range of operation