
We employ a new antenna scanning system to measure the radiation pattern of mmWave and sub-mmWave antennas in the far field and describe broadband channel measurements in distinct indoor communication scenarios for frequencies up to 220 GHz. A motorized system is used to angularly scan propagation paths in a typical office and living room. As future indoor THz communication systems rely on electronically steerable antennas, a patch antenna array with a waveguide-to-microstrip transition is designed as a representative antenna under test (AUT).
The need for higher transmission data rates is increasing daily. To cope with this demand, the use of higher frequencies up to the THz region for short range and indoor communications over the next few years seems inevitable.1Conventional RF and microwave antenna systems are becoming less appropriate with increasing frequency. The remarkable advantage of using millimeter and sub-millimeter systems is the small size of components and hence the potential for miniaturization. As a consequence, test and measurement instrumentation needed for this frequency range is also miniaturized and often more advanced.2Much improvement is necessary to make these test and measurement systems generally available to stakeholders.
Characterization of mmWave antennas is a significant issue when designing a radar or a communication system. Frequencies between 30 and 300 GHz correspond to wavelengths ranging from 10 to 1 mm. Antennas of this size can easily be characterized directly in the far field, in contrast to components at RF and microwave frequencies that are typically characterized mathematically from near field measurements.
While the concept of ultra-broadband mmWave and sub-mmWave communications is established,3 antenna and propagation measurements for channel modeling of anticipated future communication systems are hardly available. Channel characterization requires measurements of line-of-sight (LOS) and non-line-of-sight (NLOS) propagation paths4 along with reliable knowledge of antenna gains and radiation patterns. Furthermore, it includes investigation of the influence of walls and objects on propagation. This includes scattering,5 diffraction6 and shadowing effects.
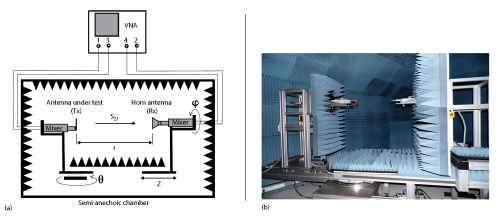
Figure 1 Measurement setup based on an antenna scanner constructed inside a semi-anechoic chamber (a). Photograph of the measurement setup.
Far Field Antenna Scanner
An antenna scanner was built at PTB for measuring the antenna radiation pattern in the far field region within a distance of up to three meters. The scanning system is able to record measurements with high accuracy at an angular resolution as small as 0.1°. The far field antenna scanner, which is sketched in Figure 1, has a rotor arm (Tx) and a rail arm (Rx). The AUT is placed on the rotor arm Tx, and the known measuring antenna is placed on the rail arm Rx. The rail arm is fixed on a track movable up to three meters from the vertical axis of the rotor arm. The rotor arm is rotatable within an angle Q from -90° to +90° around the vertical axis. Moreover, antenna fixtures on both arms are rotatable with an angle w from zero to 360° around the horizontal axis. This allows antenna measurements with any possible polarization.
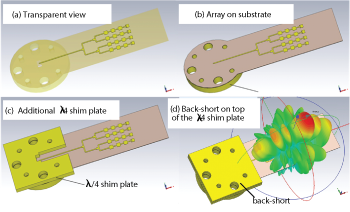
Figure 2 Transparent view (a), array on substrate (b), additional quarter-wave shim plate (c), back-short on top of the quarter-wave shim plate (d).
The scanner is installed in a semi-anechoic chamber equipped with absorbers to minimize unwanted reflections and block external signals. Since the frequency converter modules themselves are built in metallic boxes, additional absorbers are placed behind the antennas as well.
Instrumentation for Transmission Measurements
Transmission measurements based on vector network analysis are used to determine antenna characteristics (i.e., gain and radiation patterns) and propagation. For measurements using the antenna scanner, a Rohde & Schwarz ZVA-50 VNA with a ZVA-Z110 frequency extender is used to cover W-Band (75 to 110 GHz). The VNA supplies the mixers in the frequency extension modules with the necessary LO and RF signals. The measurement ports are WR-10 rectangular waveguide flanges. One port is connected to the antenna array, while the other flange is fitted with a 20 dB standard gain horn antenna.
Antenna Design
The antenna array is designed and optimized using CST Microwave Studio7based on the finite integration technique (FIT). Figure 2 shows the antenna array structure fabricated on an Ro3003™ substrate (dielectric constant ≈ 3). For signal distribution, a two-stage Wilkinson divider/combiner matches the patch to the junction line impedance.
Although the transition from rectangular to planar structures is already an established topic, it is still being improved, especially along with the development of new millimeter wave techniques.8-10 Designing a waveguide transition depends on frequency range, bandwidth and, of course, the substrate. The advantage of the transition used here is the absence of an impedance transformer and the optimized function using a back-short. Similar transitions have been presented and analyzed earlier by Leong and Shih.11,12
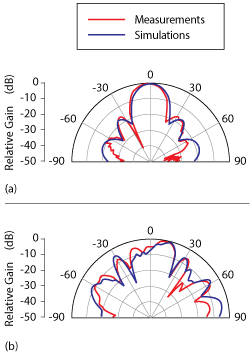
Figure 3 77 GHz antenna array radiation patterns: H-plane (a) and E-plane (b).
The output signal from the frequency extension module is coupled from the flange through a hole in the ground layer at the backside of the substrate. There, a rectangle of 2.54×1.27 mm2 is etched in the ground layer (see Figures 2a and b) to allow for wave propagation from the rectangular waveguide of the flange through the substrate and then to the microstrip line. On top of the antenna, a quarter wavelength shim plate (see Figure 2c) and a termination back-short (see Figure 2d) are placed. A slit is milled from the waveguide along the microstrip line to avoid contact between the feed line and the shim plate, allowing undistorted propagation to the antenna patches. The shim plate thickness and the feed line cavity width are optimized by including them in the antenna simulation. The shim plate combined with the back-short minimizes back-reflected radiation into the rectangular waveguide. In the substrate, the shim plate and the back-short, precision placement holes are drilled to allow for accurate positioning of the antenna on the flange of the frequency converter through locating pins. In addition to the four precision holes, another three holes are drilled for screws to tighten the substrate to the flange. The shim plate and back-short are fabricated with a high-precision CNC machine to minimize mechanical displacement.
Radiation Patterns From the Far Field Antenna Scanner
The array is placed on the converter of the rotor arm for measuring radiation patterns with the antenna scanner. A W-Band standard gain horn antenna with 20 dB gain is attached to the other frequency converter on the rail arm. Assuming D is the linear aperture of the antenna, which is the distance from the first to the last patch of the array, then the far field lies at a distance d ≥ 2D2/λ,13which exceeds 4 cm for the 77 GHz array.
The antenna array is scanned at a distance of 50 cm with 1° resolution from -90° to +90° in the horizontal plane. Figure 3 compares the time-domain simulations to a measured radiation pattern of the 77 GHz array as measured in the H-plane (a) and E-plane (b) using the far field scanner. In agreement with the simulation, the main lobe in the H-plane has a half-power beamwidth (HPBW) of 23.2°, and the side lobe level is -10 dB less than the main lobe. In the E-plane, several side and minor lobes are observed whereas the main lobe lies at about 13° from the perpendicular projection (imperfect broadside) and has a HPBW of 15°. A further design optimization could improve the directivity of the antenna. Measurements with the far field scanner, especially at the main and sidelobes, agree well with simulation.
Broadband Propagation Measurements
For modeling and design of communication systems in the lower THz frequency range propagation conditions need to be known. In the following we explain the procedure of ultra-broadband channel measurements for frequencies between 50 and 325 GHz in an indoor download scenario related to a living room environment. The measurements shown here include frequencies between 140 and 220 GHz.
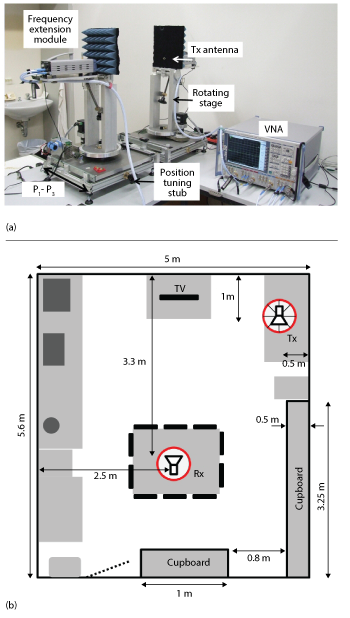
Figure 4 Photograph of measurement equipment (a) and measurement room schematic (b).
Measurement Setup
These measurements use the VNA and the frequency converters introduced earlier. A pair of the frequency converters (Rohde & Schwarz ZVA-Z220) with output couplers based on WR-5 rectangular waveguides are generating and detecting the signals. Standard gain horn antennas, each with 20 dB gain, are attached to the waveguide flanges of the frequency converters. The typical output power of the converters is about -14 dBm and the dynamic range is better than 90 dB over the entire frequency band. The frequency converters are placed on mounts that are rotated by stepper motors as shown in Figure 4a. A computer program written in LabVIEW™ controls the stepper motors and records the measurements.
Living Room Download Scenario
One of the most relevant scenarios for future mmWave and sub-mmWave indoor communications is the transmission link within a home environment, as in the case for the wireless local area network (WLAN). This implies that both transmitter and receiver establish a directed path for transmission with high data rates over a short propagation distance. To mimic this download scenario, a room equipped with appropriate furniture is prepared. The room (see Figure 4b) contains tables, chairs, cupboards for books and dinnerware, and a flat screen TV. The transmitter (Tx) and receiver (Rx) are both mounted on rotational units at a distance of 3.1 m from each other. The heights of the Tx and Rx are 1.9 and 0.72 m, respectively. In the room, most of the existing components, except the cupboards, are lower than the antennas. The Tx is placed at selected angles of 45°, 135°, 225° and 315° as shown in Figure 5. The transmitter is at the upper right corner and the receiver is at a table at the middle of the lower part. The receiver is rotated 360° with 1° resolution.
To better depict the propagation paths, the results are represented in polar coordinates as illustrated in Figure 5. The radial coordinate represents frequency and the angular coordinate represents the angle of rotation. The value of magnitude and unwrapped phase is presented according to the color bars. The radius of the circle starts with 140 GHz at the inner radius and increases with frequency to reach 220 GHz at the outer radius.
The upper part of Figure 5 shows the magnitude of the propagating signal and the lower part of the figure shows the measured phase. The measured result is depicted at the position of measurement where the receiver is placed on a table surrounded by several chairs (not shown here). The red color indicates a stronger signal where LOS and NLOS paths are identified. For example, when Tx is at 45°, the direct LOS path and multi-reflection paths are also observed. Scattering at the Rx holder also leads to additional multipath propagation.
Looking at the phase measurements, some propagation paths are more detectable and some are less depending on the received phase of the signal. Ray-tracing simulations could reveal more information about individual propagation paths, but that is beyond the scope of this article.
Conclusion
In this article we introduced measurement techniques to characterize antennas and propagation paths in typical indoor environments for future communication systems operating in the lower THz frequency range. We introduced an antenna scanning system that measured the antenna diagram with 0.1° of angular precision. A 4 × 4 patch array antenna was designed with a waveguide-to-microstrip transition and tested with this system. We also reported the broadband propagation measurements at frequencies up to 220 GHz. These measurements of magnitude and phase detected the main propagation paths – LOS and NLOS.
Acknowledgments
The authors acknowledge funding within the European Metrology Research Program (EMRP) in the Joint Research Project Metrology for Ultrafast Electronics and High-Speed Communications (JRP IND16 – Ultrafast). The EMRP is jointly funded by participating countries within the European Association of National Metrology Institutes (EURAMET e.V.) and the European Union. The authors would also like to thank Prof. Dr. Thomas Kürner and his group at the Institute for Communications Technology at Technische Universität Braunschweig for their cooperation.
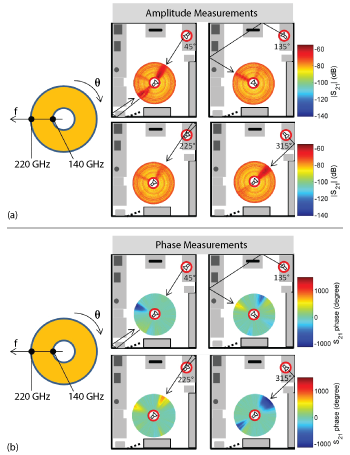
Figure 5 Data legend and measurements. Amplitude (a) and phase (b).
References
- T. Kleine-Ostmann and T. Nagatsuma, “A Review on Terahertz Communications Research,” Journal of Infrared, Millimeter and Terahertz Waves, Vol. 32, No. 2, February 2011, pp. 143–171.
- . Kleine-Ostmann, T. Schrader, M. Bieler, U. Siegner, C. Monte, B. Gutschwager, J. Hollandt, A. Steiger, L. Werner, R. Müller, G. Ulm, I. Pupeza and M. Koch, “THz Metrology,”Frequenz, Vol. 62, No. 5-6, June 2008, pp. 137–148.
- . Piesiewicz, T. Kleine-Ostmann, N. Krumbholz, D. Mittleman, M. Koch, J. Schöbel and T. Kürner, “Short-Range Ultra Broadband Terahertz Communications: Concept and Perspectives,” IEEE Antennas and Propagation Magazine, Vol. 49, No. 6, December 2007, pp. 24–39.
- . Priebe, C. Jastrow, M. Jacob, T. Kleine-Ostmann, T. Schrader and T. Kürner, “Channel and Propagation Measurements at 300 GHz,” IEEE Transactions on Antennas and Propagation, Vol. 59, No. 5, March 2011, pp. 1688–1698.
- . Piesiewicz, C. Jansen, D. Mittleman, T. Kleine-Ostmann, M. Koch and T. Kürner, “Scattering Analysis for the Modeling of THz Communication Systems, IEEE Transactons on Antennas & Propagation, Vol. 55, No. 11, November 2007, pp. 3002–3009.
- M. Jacob, S. Priebe, R. Dickhoff, T. Kleine-Ostmann, T. Schrader and T. Kürner, “Diffraction in mm and sub-mm Wave Indoor Propagation Channels,” IEEE Transactions on Microwave Theory and Techniques,Vol. 60, No. 3, January 2012, pp. 833–844.
- CST Microwave Studio, www.CST.de/, 2013.
- A. Tessmann, S. Kudszus, T. Feltgen, M. Riessle, C. Sklarczyk and W. H. Haydl, “A 94 GHz Single-Chip FMCW Radar Module for Commercial Sensor Applications,” IEEE MTT-S International Microwave Symposium Digest, Vol. 3, June 2002, pp. 1851–1854.
- . Machac and W. Menzel, “On the Design of Waveguide-to-Microstrip and Waveguide-to-Coplanar Line Transitions,” 23rd European Microwave Conference, September 1993, pp. 615–616.
- C. H. Tsai and S. J. Chung, “A Waveguide-to-Microstrip Line Transition in Multi-Layered Structure for 77 GHz Band Automotive Radar Applications,” PIERS Proceedings, August 2013, pp. 1610–1612.
- Y. C. Leong and S. Weinreb, “Full Band Waveguide-to-Microstrip Probe Transition,” IEEE MTT-S International Microwave Symposium Digest, Vol. 4, June 1999, pp. 1435–1438.
- Y. C. Shih, T. N. Ton and L. Q. Bui, “Waveguide-to-Microstrip Transitions for Millimeter-Wave Applications, IEEE MTT-S International Microwave Symposium Digest, Vol. 1, May 1988, pp. 473–475.
- C. Balanis, Antenna Theory, 1st edition, Wiley Interscience, Hoboken, N.J., 2005.
Mohammed Salhi received his Ph.D. degree in electrical engineering from the Technische Universität Braunschweig, Germany, in 2009. Since then he has been working as a researcher engineer in the Electromagnetic Fields and Antenna Measuring Techniques Group at the German National Metrology Institute (PTB) in Braunschweig, Germany. His main topics of interest are in the field of millimeter waves and terahertz technology.
Thomas Kleine-Ostmann received his M.Sc. in electrical engineering from Virginia Polytechnic Institute and State University, Blacksburg, Va. in 1999, and both the Dipl.-Ing. degree in radio frequency engineering and the Dr.-Ing. degree from Technical University Braunschweig, Germany, in 2001 and 2005, respectively. Since 2006, he has been working as a permanent scientist with the Electromagnetic Fields Group at the Physikalisch-Technische Bundesanstalt. He is currently working on realization and transfer of the electromagnetic ?eld strength, electromagnetic compatibility, and THz metrology. He became head of the Electromagnetic Fields Group in 2007, and head of the Electromagnetic Fields and Antenna Measuring Techniques Group in 2012. He received the Kaiser-Friedrich Research Award in 2003 for his work on a continuous-wave THz imaging system.
Thorsten Schrader received the Dipl.-Ing. and the Dr.-Ing. degrees in electrical engineering from the Technische Universität Braunschweig, Germany, in 1992 and 1997, respectively. In 1998 he worked for EMC Test Systems LP, in Austin, Texas (now ETS-Lindgren, Cedar Park, Texas). In 1999 he joined the working group High Frequency Measurement Techniques of Physikalisch-Technische Bundesanstalt (PTB), Braunschweig, Germany. During 2000 he was a member of the Presidential Staff Office at PTB. In 2004, he became the head of the working group Electromagnetic Fields and Electromagnetic Compatibility.Schrader has been the head of the department of High Frequency and Fields since 2005 and the working group Antenna Measuring Techniques from 2006 to 2011. His current interest is the metrology for RF quantities in the mmWave and sub-mmWave range.