


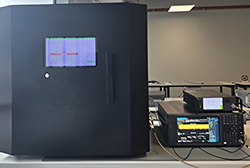
Fig. 2 Antennex Reverberation Chamber with VSG and VSA.
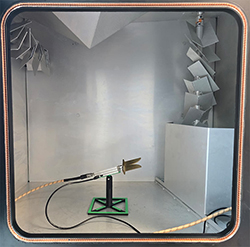
Fig. 1 LNA in combination with a Vivaldi antenna (together emulating an integrated device) in a reverberation chamber.
Error vector magnitude (EVM) is one of the gating measurements that decides whether a mobile transmitter is conformal to 3GPP. A device whose EVM exceeds the standard’s threshold is not allowed on the network because receivers can no longer reliably demodulate the transmitted symbols, violating the link-budget assumptions on which 3GPP receiver performance and interoperability rest. Beyond conformance, most phone manufacturers measure EVM on every device they ship as part of in-line production quality control.
Over-the-air (OTA) EVM has historically been difficult to measure routinely in a reverberation chamber (RC): the long, frequency-selective channel impulse response created by the chamber and stirrers introduces inter-symbol interference that prevents the receiver from demodulating the signal. This article describes a development at Antennex that characterizes and de-embeds the chamber’s linear response, enabling accurate measurement of EVM and modulation distortion within an RC (see Figures 1 and 2 for photos of the setup).
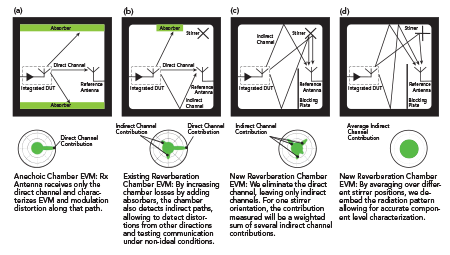
Fig. 3 Visualizations of how EVM is measured traditionally in (a) an AC, (b) an RC. In (c), the concept used by Antennex is visualized, in which the RC is in a certain stirrer configuration and (d) when averaged over multiple stirrer orientations.
HOW TO MEASURE EVM AND MODULATION DISTORTION OTA
EVM and modulation distortion are traditionally measured on RF components and RFICs with well-defined input and output ports. As integration increases and antennas are directly connected to the RFIC, it becomes less straightforward to assess RFIC-induced distortion because antennas radiate in multiple directions simultaneously. Conventionally, the EVM of integrated devices has therefore been measured from a single direction only, for instance, in an anechoic chamber (see Figure 3a), thereby accepting (or not realizing) that such a measurement does not provide a complete picture of the modulation distortion caused by the device.
An RC is a multipath environment by design and, in general, capable of measuring device properties independent of their position and orientation. The stirrer and the chamber walls scatter the signal and the channel impulse response stretches in time. When such a channel acts on a modulated signal, the result is inter-symbol interference (ISI). If the ISI is large, the communication tester (such as a base-station emulator) cannot demodulate the signal, preventing a proper EVM measurement. Therefore, traditionally, EVM has been measured in an RC with line-of-sight conditions between the transmitter and the receiver. Often, absorbing material is used to reduce multipath and thereby flatten the channel’s frequency response, as illustrated in Figure 3b. Although such an environment comes closer to understanding the modulation distortion caused by the device than an anechoic chamber does, since distortions from multiple angles are measured, still the antenna pattern is not fully de-embedded and the dependence on alignment remains. On top of that, adding absorbers to the chamber reduces the ability to measure high-quality integrated power metrics, such as total radiated power (TRP) or occupied bandwidth (OBW), making it not straightforward to combine these measurements.
A NEW APPROACH TO EVM MEASUREMENTS
The new approach presented in this article is straightforward: if a chamber’s linear distortion is characterized, it can be de-embedded. This de-embedding step is equivalent to removing the linear multipath distortion that causes ISI, but nonlinear distortions remain in the measured signal. After de-embedding the linear distortions, the signal is fed to the demodulator and EVM can be extracted. This step brings the measurement plane to a virtual sphere around the device, as indicated in green in Figure 3c for that specific configuration of the stirrers inside the chamber. Then, by rotating the stirrers and thereby making the electromagnetic conditions uniform, the virtual sphere around the device becomes smooth, as indicated in Figure 3d. As a result, each spatial contribution is weighted equally and the overall modulation distortion caused by the RF electronics can be measured independently of the position, orientation or beam-steering angle of an array.
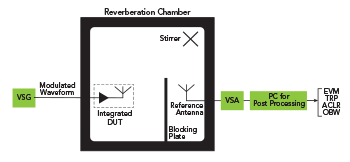
Fig. 4 Block diagram of the EVM measurement path, with the chamber correction shown as a discrete stage between the VSA capture and the demodulator.
The measurement setup itself is conventional and is shown in Figure 4:
- A vector signal generator (VSG) drives the device under test (DUT). If the DUT is an autonomous emitter, such as a phone, the VSG is part of the DUT.
- The DUT, mounted inside the chamber, transmits a modulated waveform.
- A reference antenna inside the chamber captures the radiated signal.
- A vector signal analyzer (VSA) digitizes the captured signal and applies the chamber correction that is derived from the captured signal.
- The corrected signal feeds a standard algorithm to calculate EVM, ACLR or the like.
- Based on the desired measurement uncertainty, the stirrer is rotated, and the DUT is measured once more.
The statistical nature of an RC creates a trade-off between measurement uncertainty and measurement time. This ultimately allows a test engineer to optimize between the two, which is particularly useful for in-line RF testing. Under the conditions presented in this article, the measurement time is sub-second for each stirrer configuration, and it is found that metrics as EVM, TRP and OBW converge to reliable results after only a few stirrer configurations.
THE SIGNATURE RESULT: THE BATHTUB CURVE
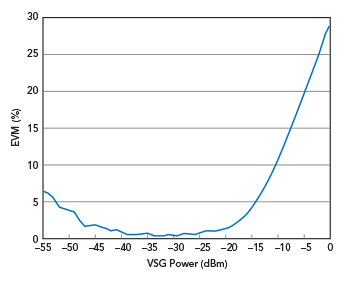
Fig. 5 Block diagram of the EVM measurement path, with the chamber correction shown as a discrete stage between the VSA capture and the demodulator.
The result that ties the story together is the EVM bathtub curve in Figure 5. The plot shows EVM as a function of input power, swept across the operating range of a representative mobile transmitter. The shape is one any RF engineer who has worked with EVM will recognize.
At low input power, the measurement is limited by the VSA’s noise floor. Additive noise dominates, degrading signal quality and producing a relatively high EVM. As input power increases, the signal-to-noise ratio improves and EVM decreases. The curve flattens at the bottom of the bathtub, around 0.5 percent. This is the device’s linear sweet spot. Both the device and the measurement chain operate cleanly and the chamber contributes no additional EVM despite its rich multipath environment.
As input power continues to rise, the device enters compression. The amplifier becomes nonlinear, and intermodulation products appear, distorting the waveform and increasing the EVM. This time, the increase comes from the device itself rather than from the measurement setup.
OBW AND TRP FROM THE SAME MEASUREMENT
The same dataset yields other metrics at no additional cost.
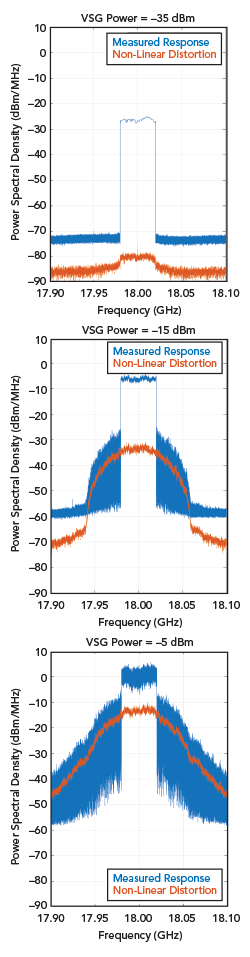
Fig. 6 Output spectrum at three points on the bathtub curve.
OBW: Each point on the bathtub curve corresponds to a specific output spectrum. At low input power, the spectrum sits cleanly within the allocated channel and the only out-of-band content is the analyzer’s noise floor. As input power rises and the device enters compression, the in-band frequencies generate intermodulation products. The result is spectral regrowth, as shown in Figure 6. Evidently, the power radiated into adjacent channels (termed ACLR or ACPR) or the occupied bandwidth (OBW) can be determined, and compliance with a spectral emission mask (SEM) can be verified using this data.
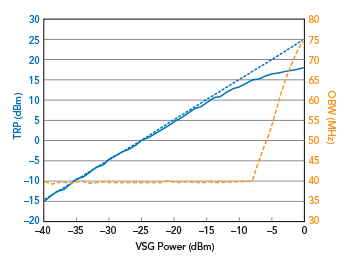
Fig. 7 TRP and OBW versus output power of the VSG.
TRP: Once calibrated, the chamber provides an absolute power reference. TRP is derived from the integrated received power, with antenna efficiency and receiver cable losses accounted for during calibration. From the same swept-power measurement, the TRP can be calculated, as shown in Figure 7. The solid blue curve represents the TRP of both in-band and out-of-band radiation. For low VSG output powers, the TRP increases linearly, but the curve flattens as the device compresses. To illustrate the effect on the spectrum, the OBW is shown with the dashed orange line in the same figure. In the linear region, the OBW remains nearly constant over a wide range of input powers, but once the device compresses, the OBW increases due to significant spectral regrowth. By performing these absolute power measurements, your device can be properly calibrated in production, enabling it to be driven close to regulatory emission limits.
WHAT THIS MEANS FOR HANDSET PRODUCTION
The presented capability fits well within production quality control. Most handset manufacturers test every device they ship for EVM, often against a per-device threshold. If the manufacturer has already established that the design is good through conformance testing, the production-floor test serves a different purpose: a fast, repeatable check or tuning process to ensure that every unit coming off the line matches the golden reference. A reverberation chamber is the right tool for fast, repeatable, position-insensitive measurements at production volume and the EVM, OBW and TRP combination covers most of what a calibration line cares about.
TRP uncertainty, in particular, has a direct impact on product performance. Manufacturers calibrate every device to operate just below the regulatory and 3GPP power-class ceilings. If the TRP measurement uncertainty is large, the manufacturer must leave a margin and the device is calibrated further below the ceiling than necessary. Lower TRP uncertainty allows the device to operate closer to the limit, resulting in better range and an improved user experience.
ROADMAP: DIGITAL EVM AND CONSTELLATION DIAGRAMS
The current implementation reports analog EVM, OBW and TRP from a swept-power measurement. The next step extends the same chamber-characterization framework to digital EVM and constellation-diagram visualization, with the demodulator running the full receiver chain and reporting per-symbol error vectors relative to the ideal constellation.
Because the chamber correction already removes the ISI caused by the channel before the demodulator, the path to digital EVM is incremental rather than fundamental. Antennex expects to deliver this capability before the end of 2026.