
Emerging technologies and advanced applications drive the need for increasing data rates and the trend towards higher frequencies. When RF engineers develop devices, phase noise testers help gain critical insights into a signal’s frequency stability and purity. Rohde & Schwarz (R&S) offers the industry reference for phase noise testing, the R&S FSWP phase noise and VCO tester. Thus far, the instrument features a maximum frequency of 50 GHz without external frequency extenders. Although extenders are available to measure phase noise up to 325 GHz at the push of a button, they add complexity to the setup.1
EMERGING APPLICATIONS UP TO 56 GHZ
Applications are emerging in the range up to 56 GHz, such as satellite communication between 50.4 GHz and 52.4 GHz, jitter measurements for ultra-fast LAN IEEE 802.3dj at 53 GHz and CEI-224G (Common Electrical I/O) at 56 GHz. To address these new testing needs, Rohde & Schwarz has extended the R&S FSWP with a new option, R&S FSWP-B56G, which extends the frequency range for absolute phase noise measurements up to 56 GHz, eliminating the need for external frequency converters.
ENHANCEMENTS FOR PHASE NOISE MEASUREMENTS
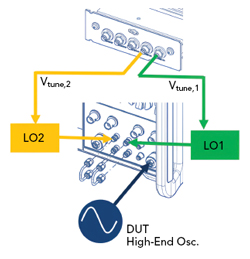
Figure 1 Setup with two external signal sources to measure a high-end DUT.
The R&S FSWP-B56G option also extends the instrument’s capability for additive/residual phase noise measurements on amplifiers or other components up to 56 GHz with frequency offsets up to 40 MHz. The frequency range of the internal source for this application is now extended to 50 GHz (previously 18 GHz) and up to 54 GHz with the R&S FSWP-B56G option. Users can easily measure the added noise of an amplifier by simply connecting it between the output of the signal source and the input of the R&S FSWP. Instead of using the internal source, an external signal source, such as a high-end signal generator or oscillator, can be added to the setup to be used as a local oscillator.
UTILIZING EXTERNAL SIGNAL SOURCES
Besides extending the frequency range to 56 GHz, the R&S FSWP now supports external signal sources as local oscillators for absolute phase noise measurements. Engineers often prefer using in-house high-end sources instead of the R&S FSWP’s internal sources, which, while covering a wide range from a few MHz to 56 GHz, may not match the performance of specialized oscillators designed for narrower frequency ranges. Utilizing these high-end external sources allows for faster results, as fewer cross-correlations are needed to measure the phase noise of the device under test (DUT), which could be another high-end oscillator. Depending on the quality of the sources, measurements can be up to 1000x faster than internal sources. Figure 1 shows a typical setup using two external sources as local oscillators to measure a high-end DUT. The signal sources can be locked to the DUT frequency using the tuning outputs of the R&S FSWP.
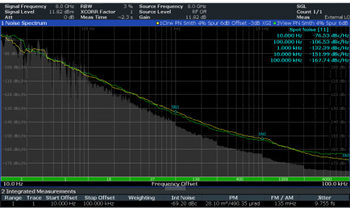
Figure 2 Typical measurement of two SLCOs, applying the two DUT method.
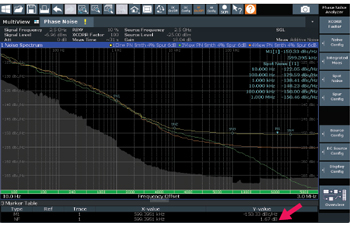
Figure 3 Additive/residual phase noise of an amplifier.
In this mode, users can measure with two external oscillators to fully benefit from cross-correlations, or they can measure two identical sources against each other (two DUT method) and adjust the results by 3 dB. This mode is effective up to 56 GHz. If the sources cannot be tuned and locked to the DUT, measurements can still be performed with a constant offset between the sources.2 However, the maximum offset is limited to around 10 MHz. Figure 2 illustrates a typical measurement where two sapphire-loaded cavity oscillators (SLCOs) are measured against each other. The green trace shows the performance of an SLCO measured with the internal sources with 100 averages applied. The yellow trace shows the result with just one correlation measured with two SLCOs (two DUT method). Only one cross-correlation is needed to reveal the performance of the high-end oscillators, compared to potentially needing up to 100 correlations with internal sources.
INTRODUCING THE NOISE FIGURE MARKER
A new marker function, the noise figure marker, has been added for additive/residual phase noise measurements on amplifiers. The phase noise at lower input power directly reflects the noise figure of the amplifier.3,4 The only parameter that needs to be known is the input power at the amplifier’s input, which can be set at the signal source output or measured directly with a power sensor. The noise figure of the amplifier can then be calculated using this formula:
NF = - (-177 dBm/Hz) + Pin + Phase noise
This new method, based on phase demodulation, provides a way to measure the small signal noise figure of amplifiers, in addition to the cold source method commonly used in network analyzers and the Y-factor method used in signal and spectrum analyzers. The R&S FSWP, now covering frequencies up to 56 GHz, offers both the Y-factor method — using noise sources with a calibrated ENR in the spectrum analyzer — and noise figure measurement based on demodulation in the phase noise tester.
Figure 3 shows a typical measurement, where the noise figure marker result (here 1.67 dB) can be seen in the table. The green trace shows the added phase noise at high input levels. The orange and yellow traces with lower input level are dominated by the wideband noise at offsets > 100 kHz, which can be used to calculate the small signal noise figure.
FUTURE ENHANCEMENTS AND MODEL UPDATES
With its new enhancements, the R&S FSWP phase noise and VCO tester expands its applications through an extended frequency range and features like the noise figure marker. By supporting external sources as local oscillators, it combines the user-friendly nature of a signal source analyzer with the capabilities of a high-end phase noise tester. Previously, such instruments were complex and required significant time to set up and run measurements. Now, the R&S FSWP simplifies this process.
The other models, R&S FSWP8 and R&S FSWP26, will receive the same enhancements in the coming weeks. Further improvements to the R&S FSWP are planned and will be announced over the next 12 months.
References
- Dr. W. Wendler and M. Schmähling, Application Note, 1EF101, 2018.
- 2. M. Giunta, B. Rauf, S. Pucher, S. Afrem, W. Wendler, A. Roth, J. Kornprobst, S. Peschl, J. Schulz, J. Schorer, M. Fischer and R. Holzwarth, “Cross-spectrum Phase Noise Measurements of 10-15-level Stability Photonic Microwave Oscillators, IEEE MTT-S International Microwave Symposium (IMS) 2025, Th2D-4.
- 3. K. Gheen, Application Note, 1EF100, 10.2017.
- 4. Application Card, Version 01.00, Dynamic noise figure measurements.
Rohde & Schwarz
Munich, Germany
www.rohde-schwarz.com