
Cover Feature
A Complete Spectral System Analysis for RF/Microwave Engineers
Eagleware Corp.
Norcross, GA
Historically, RF and microwave system designers have been forced to resort to a hodgepodge of commercial and custom-written software to characterize and simulate the frequency-domain behavior of complex RF systems and subsystems. This approach tends to increase design time due to data transfer between incompatible applications and often leads to multiple design turns from insufficient modeling and characterization of the system components. Companies were forced to use this approach because of the lack of commercially available simulation software capable of fully representing not only the system design phase, but component-level design as well. SPECTRASYS, a new spectral domain system simulator, allows full characterization of systems in the spectral domain, and allows engineers to integrate system-level analysis and optimization with circuit-level (linear and nonlinear) and electromagnetic simulation. This integration unifies the entire RF system design process by maintaining tight coupling between the various development stages from concept to production.
Spectral Domain Analysis
SPECTRASYS incorporates a new approach to RF/microwave system analysis: spectral domain simulation. This approach allows engineers to specify entire spectrums, including measured data for frequency sources such as oscillators and antennas. In traditional system simulation methods, spectrums were all but ignored. In cases where power spectrum simulation is supported, the spectrum produced is typically the result of a Fourier transform from time domain analysis data. While informative, this type of analysis takes millions of sample points to see an audio-frequency sideband on a X- or K-band carrier. Besides being a memory hog, this method can take tens of seconds or minutes to analyze a constrained bandwidth spectrum for a static schematic. Other applications arrive at faster calculations by making narrow band assumptions, thereby ignoring important spectral components. Following from this, real-time tuning or optimization based on harmonic constraints was completely impractical.
SPECTRASYS avoids this inefficiency by automatic native calculation of spectrum components for every node in the schematic. Spectrum plots are simple to create, manipulate and manage. Furthermore, SPECTRASYS makes it easy to do what has previously been impossible - to find the origin or method of creation for any spectral component. In other words, whether the spectral component in question came directly from a frequency source, or was generated through a sneak path of several mixers and subsequent amplification, SPECTRASYS identifies the component origin.
Fig. 1 GENESYS continuous integration flow chart.
Continuous Integration
As most system engineers will testify, system design cannot exist in a vacuum apart from component-level design. In other words, unless a system is thoroughly modeled including device interaction (non-unilateral elements) and emissions, the resulting component-level design will almost certainly not meet performance expectations. For example, consider that distributed element filters always exhibit a behavior known to filter designers as reentry. This means that a distributed bandpass filter will have more than one "passband" at multiples of the pole frequencies. Unless this behavior is anticipated, fully modeled and included in the system-level simulation, unexpected spectral components can "leak" through the filter's extra passband(s) where the system designer expected a stopband to occur. However, few behavioral system-level models accurately account for radiation, dielectric loss and network impedance levels. As a result, scenarios such as this often result in extra design cycles to eliminate unwanted spectral components.
To alleviate these problems, the analysis tool should be able to handle component-level as well as block-level simulation. Eagleware calls this continuous integration. Continuous integration allows design teams to gradually fill in actual networks for system blocks via network synthesis, behavioral models or custom schematics. For ultimate simulation accuracy, engineers are able to read measured data to characterize individual system blocks. For frequency sources such as antennas and oscillators, measured spectral data may be used, with no limit to the data resolution. This is especially useful when using "off-the-shelf" components and subsystems.
By specifying individual block sub-circuits or measured data, the design team is able to quickly identify performance degradation at the system-level. Then, the system engineer can optimize or tune remaining system block parameters to compensate. For example, in the previously described distributed filter scenario, once the filter is inserted into the system, continuous integration allows the designer to inspect overall system performance with the actual filter in place. Then, before other blocks are designed, the system engineer can adjust block parameters (or change the filter specifications and redesign it) to attempt to compensate or adjust for this non-ideal behavior. This saves design time and potentially design turns by allowing the circuit-level design team to work coincidentally with the system engineers to identify unintended or unwanted behavior before the entire system is characterized.
Figure 1 shows the continuous integration flowchart. At all steps in the design process, from system architecture definition all the way to documentation, GENESYS with SPECTRASYS allows automatic data transfer and manipulation for circuit- and system-level design. This means that engineers no longer have to use a multitude of design software for RF system design and analysis. By having an all-encapsulating environment, engineers are also more prone to conduct "what if" scenarios, resulting in more design innovation.
Problems with Historical Approach
In addition to ease-of-use and continuous integration, SPECTRASYS is written to specifically address a host of issues and challenges faced by companies utilizing the typical piecemeal design process. As mentioned before, due to the lack of sufficient modeling software on the market, many companies conducting system-level design today have been forced to create custom software. While custom software is generally very good at solving specific problems, there are many drawbacks to its development and use. For example, engineers must write custom software, taking time away from the task at hand: hardware design. Custom software requires internal support. Design engineers waste time learning to write analysis software. Custom software is not written for general analysis, making it very difficult to conduct "what if" scenarios. It is also usually limited to simple linear frequency-domain circuits and simplifying assumptions. Engineers waste time developing internal software documentation or do not document, resulting in software that is not re-usable. In addition, it is difficult to work with spectrums, for there is no interface available for defining measured spectrums. Conducted emissions are left to "guess work." There is no integration with synthesis or component-level simulation. Generally, custom software is restricted to "block-level" designs and a limited number of carriers. SPECTRASYS addresses each of these issues, and much more.

Fig. 2 Schematic of a feedforward amplifier.
Design Example
Figure 2 shows the schematic of a feedforward amplifier. Feedforward amplifiers are typically very challenging to design and manufacture to achieve the desired RF performance. Furthermore, they can be very difficult to tune and adjust to achieve the necessary cancellation of interference at the amplifier output. SPECTRASYS can help the designer determine ranges and requirements for all of the stages in the block diagram.
Feedback loops are often challenging for simulation software. However, SPECTRASYS meets these challenges and will allow the user break loops at the desired points to determine the open loop behavior of the system. For instance, one of the first things the designer would want to see is the error signal, which is a representation of the input signal along with the distorted signal at the output of the main amplifier (RFAMP_1). If desired, the designer could break the loop in one of several places to eliminate any unintentional (sneak) paths that may get in the way of looking at the intended signal. The loop could be broken at the output of the splitter (SPLIT2_1) or the output of COUPLER1_2, or both. At that point the user could focus on the error spectrum at the splitter output. The phase (RF_PHASE_1) and delay (RF_DELAY_1) could then be adjusted until cancellation is observed at the splitter output. Once the desired error signal is achieved then the remaining loop can be added to observe the cancellation of the error signal with the main amplifier signal. The phase (RF_PHASE_2) and delay (RF_DELAY_2) can now be adjusted to achieve the necessary cancellation of intermodulation in the main signal.

Fig. 3 Feedforward amplifier spectrum showing sneak path intermods at input port.
Since SPECTRASYS gives a correct representation of the spectrum at any node in the schematic (see Figure 3 ), the user can learn a lot about unintentional signal leakage through a system, often called sneak path(s). A good illustration of this is the spectrum located at the input port of the feedforward amplifier. Notice that besides the four input tones and the noise (set at -150 dBm) there are also other intermods. At an initial glance this would appear to be incorrect since the only spectrum expected at the input is the four input tones. However, closer examination reveals that the intermods are generated in the main RF amplifier (RFAMP_1) and are conducted through the isolation path of the last coupler (COUPLER1_3) back through the reverse isolation of RFAMP_2, SPLIT2_1, and finally through the main coupled path of COUPLER1_1. Consequently, increasing the directivity of the COUPLER1_3 or the reverse isolation of RFAMP_2 is needed to improve the intermods present and the input. The user may not actually care about the intermods at the input in this particular case but this example illustrates how easy it is to find an unwanted signal without committing the artwork to layout or building a prototype.

Fig. 4 Schematic of a superheterodyne base station receiver.
A Second Design Example
Figure 4 shows the schematic of a base station receiver. The receiver has a front-end and the capability to support four receivers with the splitter outputs. A filter, low noise amplifier (LNA), attenuator and four-way splitter make up the front-end of the base station receiver. A simple single conversion receiver has also been included in the schematic even though there is no limitation to the number of conversion stages or architecture. The receiver section includes an amplifier, image reject filter, attenuator, mixer, diplexer and the IF chain which includes, amplifiers, filters, couplers and attenuators. The diplexer consists of a filtering network, which allows the desired IF difference frequency of 220 MHz to pass through the IF chain and provide a good out of band match for all other frequencies. A small-signal of -100 dBm is provided as the base station input and the frequency of the RF and LO are gang-tunable through equations so that the user can easily simulate receiver channel switching.
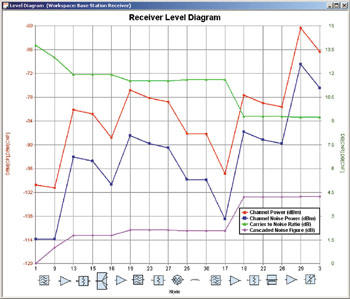
Fig. 5 Receiver level diagram without image noise included.
Figure 5 shows the receiver level diagram. A user-definable path is used to create the level diagram, in this case from node 1 to node 3. The schematic symbols and node numbers are located at the bottom of the diagram to aid the user in determining the exact performance along the path, and as a visual aid to identify components connected between the nodes analyzed. As can be seen from this diagram, both the desired signal channel power and the noise channel power come closer together as these signals progress along the path. This is expected since the cascaded noise increases along the path and the carrier-to-noise ratio decreases. Using tables and level diagrams, designers can quickly see the limitations of the performance of the system and which elements may need optimizing to improve system performance.
Image noise has traditionally been very hard to deal with accurately in any simulation package until now. With SPECTRASYS, broadband high frequency noise processing is easy. The displayed level diagram is for a typical receiver whose basic performance can be approximated with simple calculations techniques (assuming no SWR interactions and perfect matching conditions). However, assessing the correct cascaded noise figure, including the effects of SWR and image noise, is much more challenging. SPECTRASYS is able to deal with broadband noise and will fold all noise power just as an actual receiver would. This can be easily illustrated by simply replacing the image rejection filter in the schematic (BPF_BUTTER_1) with an attenuator of the same loss as the insertion loss of the filter. The resulting level diagram is shown in Figure 6 . As expected, the cascaded noise figure should increase by about 3 dB at the output of the mixer (node 25). This is due to the noise at the image frequency of 2170 MHz that is created by the two RF amplifiers ahead of the mixer.
Getting accurate sensitivity and RF performance measurements that include high frequency broadband noise, intermods, SWR effects and other spurious components is now not only possible, but easy with SPECTRASYS. Design turns are eliminated due to these effects since designers will have a much better understanding of the RF performance of the system before committing the design to artwork and manufacturing.

Fig. 6 Receiver level diagram with image noise.
Available Measurements
With SPECTRASYS, engineers are able to see the complete spectrum at any node in the schematic just as would appear on a spectrum analyzer. In addition, the system allows users to separate the noise resolution bandwidth from the signal resolution bandwidth.
Although many of the features and capabilities of SPECTRASYS are not covered in this article, a list of some of the measurements includes adjacent channel frequency, added noise, channel frequency, conducted third-order intermodulation power, cascaded gain, cascaded noise figure, channel noise power, carrier-to-noise ratio, channel power and desired channel power. Other measurements include generated third-order intermodulation power, input third-order intercept, mixer image frequency, mixer image channel power, mixer image rejection ratio, offset channel frequency, offset channel power, output third-order intercept point, spurious free dynamic range, stage gain, stage noise figure and total third-order intermodulation power.
SPECTRASYS is available immediately, running on Windows 98/2000/ ME/NT/ME/XP. Additional information is available on the Web at www.eagleware.com, or via e-mail at eagleware@eagleware.com or by fax at (678) 291-0971.
Eagleware Corp., Norcross, GA (678) 291-0995.
Circle No. 302