
POPULAR APPROACHES
Having classified various enhancement mechanisms and discussed their effects on theoretical amplifier blocks, including advantageous effects from hybrid approaches, the discussion moves from theory to practice, classifying the popular enhancement methods according to the mechanisms they use (see Figure 5). Using a Venn diagram for classification helps identify where additional schemes are complementary and may further improve efficiency.
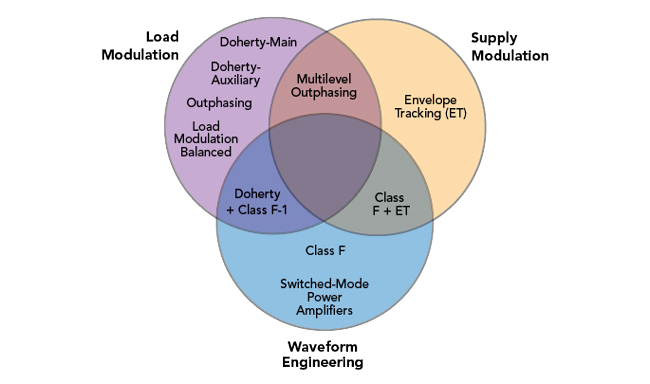
Figure 5 Efficiency enhancement mechanisms, their hybrids and possible areas for further improvement.
For example, the Doherty amplifier, which applies load modulation to its constituent amplifiers, can be improved by adding supply modulation, especially to the main channel, and/or waveform engineering, by modifying the design to incorporate class F-1 operation, for example.
Harmonic Load-Pull
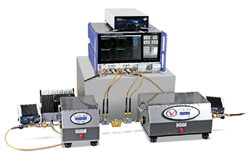
Figure 6 Maury load-pull test system using the R&S®ZNA VNA.
A bottleneck is getting real world, practical devices to use the theoretical enhancements. For example, a typical GaN device may be sensitive to efficiency enhancement by load modulation over a 5-10:1 impedance range. However, when used as the main device in a Doherty architecture, it is typically exploited only over a 2-3:1 range. The Doherty scheme will fail to maximize the potential performance of the device.
Harmonic load-pull measurements over a range of bias conditions make it possible to establish the maximum performance envelope for the device technology. Load-pull data can be obtained using various setups, such as Maury Microwave’s harmonic load-pull test bench with an R&S ZNA vector network analyzer (see Figure 6). By comparing harmonic load-pull measurement data with the theoretical performance of a selected high efficiency technique, the performance gap can be quantified, answering the question of the difference between what has been built and the performance limit. Alternatively, if the device is assumed to be the bottleneck, the harmonic load-pull measurement data enables a scheme to be designed to maximize its potential, using the optimal enhancement mechanisms in the correct proportions.
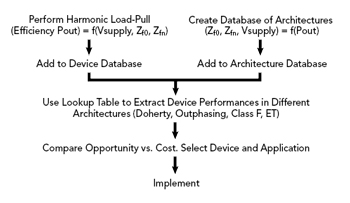
Figure 7 Process flow to achieve the best device-architecture pairing.
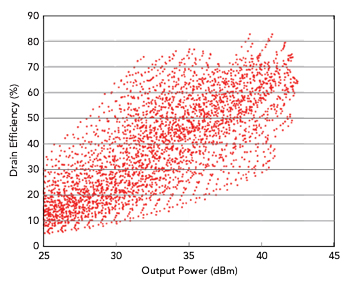
Figure 8 Single-ended GaN transistor drain efficiency and output power vs. swept input power, supply voltage (10, 20 and 28 V) and fundamental, second and third harmonic impedances.
Thus there are several ways to use the data from a rigorous and repeatable setup for measuring load-pull. One is to create characterization and architectural databases for cross-referencing device performance with various circuit architectures and enhancement methods: Doherty, load modulated, balanced, outphasing, etc. The design flow of Figure 7 shows possible steps for setting up and using a look-up table for assessing device performance and enhancement techniques. To illustrate the concept, a commercially available Wolfspeed GaN transistor (CG2H40010) was characterized at a fundamental frequency of 2 GHz and a bias current of 100 mA using a Maury harmonic load-pull test bench. The measurement data was analyzed to understand device performance in a Doherty amplifier, then compared with the maximum performance possible from the device. Figure 8 shows the output power and drain efficiency as the input power, fundamental and harmonic terminations and supply voltages were swept. This scatter plot provides the performance limit of a single-ended device; to achieve drain efficiency greater than 50 percent, the dynamic range of the output power approaches 15 dB.
For a Doherty amplifier, the (simplified) relationship between output power and impedance is defined by:
iaux = 2imain-1, where imain, the normalized output current from the main transistor, varies from 0 to 1.
iaux = 0 where iaux < 0. iaux is the normalized output current of the auxiliary device.
The normalized impedances presented to the main and auxiliary transistors are
Zmain = 2 - iaux/imain and Zaux = 1/(iaux/imain), respectively.
The output power contributions from the constituent amplifiers are given by
Pmain = imain2 × Zmain and Paux =iaux2 × Zaux
In this Doherty example, a theoretical output current relationship is used, although the equation relating iaux and imain can be changed, using a square law auxiliary relationship for example, where iaux=√imain. The impedance values Zmain and Zaux may be scaled to any value in the dataset. In this case, 10 Ω is used as a multiplier prior to the look-up operation; fixed values for the harmonic impedances have also been chosen prior to look-up. With the definition for output power and impedance for the main and auxiliary devices, the look-up-table operation is performed on the measurement data to extract the drain efficiency, with interpolation of the measurements used to determine intermediate values.
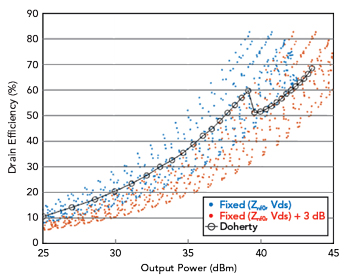
Figure 9 Calculated drain efficiency and output power vs. measured drain efficiency and output power with fixed supply voltage and harmonic impedances.
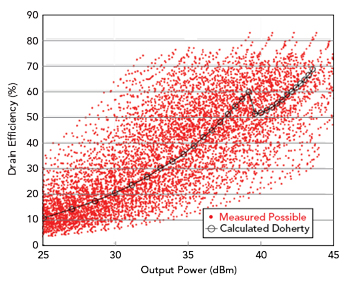
Figure 10 Calculated drain efficiency and output power vs. measured drain efficiency and output power showing full supply voltage and harmonic impedance variations.
With the output power and drain efficiency for the main and auxiliary known individually, the composite power consumption and output power can be calculated. The simulated output power and drain efficiency of the Doherty power amplifier is plotted in Figure 9, using the measured data for the look-up operation. Because two devices are used in a Doherty, the output power capability is 3 dB higher, so a second scatter plot of the measured data, increased by 3 dB, is included. The second scatter plot represents the performance limit. The load modulation mechanism offered by the Doherty architecture - the limited 2:1 modulation range presented to the dominant main device, combined with the arbitrary impedance trajectory selected for this illustration - does not fully exploit the device’s capability for load modulation. The device is, in effect, being driven in first gear. While the measurement space indicates a capability of 8 dB dynamic range achieving at least 50 percent drain efficiency, the Doherty only manages to exploit about 5 dB of that range, also missing a couple of dB of saturated output power. The same extracted Doherty performance plotted on the entire measurement space, including the full harmonic and supply variations, is shown in Figure 10. For efficiency of 50 percent or greater, the output power dynamic range is now nearly 18 dB with the addition of the auxiliary transistor’s 3 dB contribution. Clearly the performance of the Doherty in this example would benefit from the addition of supply modulation and/or waveform engineering.
This model for the Doherty could be more sophisticated, including other effects without detracting from the basic flow. Alternatively, it could be that a different enhancement scheme offers a greater benefit for the device, whether tailored from the ground up or off-the-shelf. Other concepts can be analyzed using different equations and look-up parameters. For example, using the outphasing architecture, the impedances presented to the voltage source devices are derived from the cotangent of the inverse sine of the output amplitude.1
CONCLUSION
A classification of efficiency enhancement mechanisms has been proposed, and their effects on class A and class B amplifiers described, allowing for complementary mechanisms to be identified.
It is suggested that harmonic load-pull measurements, over a range of supply voltages, which are analogous to the mechanisms, can fully extract the performance potential of the device.
From those measurements, performance of the device in a range of architectures (e.g. Doherty) can be predicted.
State-of-the-art devices, such as the Wolfspeed device illustrated in this article, are capable of much better performance than state-of-the-art architectures.
Therefore, that designing a “good enough” supply-modulated harmonic load-pull, appropriate for the application at hand, should be a goal for those responsible for developing power efficient RFFEs.
ACKNOWLEDGMENT
The author would like to thank Maury Microwave for providing the measurement data.
Reference
- Cripps, S. C., “RF Power Amplifiers for Wireless Communications,” 2006, Artech House, Norwood, Mass., Chapter 3.