
PRODUCT FEATURE
Wireless Telecommunications Testing with S-series Microwave Power Amplifiers
Amplifier Research
Souderton, PA
Amplifier Research offers a broad range of power amplifiers covering DC to 40 GHz with output power ranging from 1 to 10,000 W. While applications include electromagnetic compatibility (EMC) testing, RF component testing, physics (plasma generation) and chemistry (mass spectroscopy), military (jammers, radar), material testing (ultrasound), medical diagnostic testing (NMR, MRI) and general lab use, this article focuses on a line of amplifiers that has been optimized for wireless telecommunications test use.
The term wireless communications encompasses a number of applications. In addition to analog and digital cellular telephone service, wireless includes the new personal communications services (PCS), analog and digital cordless telephones, pagers, Global Positioning Systems, wireless local area networks, satellite television, garage door openers, remote controllers and the new Bluetooth technology used to interconnect a wide range of computing and telecommunications devices via a low power short-range RF link.
The last two decades have seen an explosion in the use of wireless telecommunication. From the first cellular telephone system, the Advanced Mobile Phone Service (AMPS) introduced by AT&T in 1983, to the PCS that are currently in vogue, telecommunications test system demands for ultra-linear test amplifiers have never been greater. An additional requirement of a test amplifier is broadband frequency coverage. Table 1 lists the frequency ranges for both cellular and PCS wireless telecommunications systems, Bluetooth and the latest 50MHz block of frequency spectrum allocated for commercial wireless services by the Federal Communications Commission.1 This table clearly shows a significant frequency spread from 824 MHz to 3.7 GHz. The need for wideband linear test amplifiers to support these applications has been answered by the S-series class A linear microwave amplifiers optimized for telecommunications testing. With maximum bandwidths from 800 MHz to 4.2 GHz, the S-series provides testing margin on either side of the wireless frequency allocation spectrum.
|
|

In addition to covering a broad frequency spectrum, wireless applications require amplifiers that are very linear. An ideal amplifier would faithfully reproduce the applied input signal without adding additional frequencies (spurious) to the output signal. Unfortunately, real amplifiers are characterized by some degree of nonlinearity. While design engineers strive to develop linear amplifiers, they are limited, at the very least, by the inherent nonlinearities of the diode junctions that comprise many of the active devices found in most amplifiers. This would not be a serious problem for a single frequency application, but the very nature of telecommunications suggests more than one signal, or tone, is applied to the amplifier. The result of applying two or more tones to real amplifiers that exhibit a degree of nonlinearity is intermodulation distortion (IMD). IMD is nonlinear distortion characterized by the appearance of signals at the output of the device that are linear combinations of the fundamental frequencies and all harmonics present at the input of the amplifier. The signals produced are often referred to as the sum and difference products, and are defined by a power series expansion of the output device collector current. The unwanted frequencies are represented by the expression
fs = ±Mf1 ±Nf2 (1)
where
|
fs |
= |
spurious response frequency |
|
M&N |
= |
positive integers >= 1 |
|
f1 |
= |
frequency of tone 1 |
|
f2 |
= |
frequency of tone 2 |
The order of the product is M+N.
Figure 1 shows the output of a typical amplifier that includes the desired fundamental signals f1 and f2 , as well as the spurious products created by IMD.
|
|
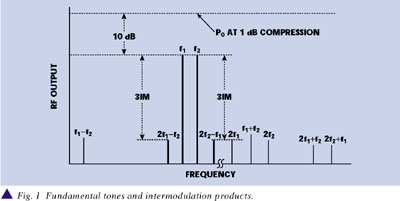
It is apparent from the graph that the third-order intermodulation products (2f1 f2 ) and (2f2 f1 ) are the most significant contributor to distortion in that they are very near the fundamental tones and are not readily filtered out as is the case of the third-order intermodulation products (2f1 +f2 and 2f2 +f1 ) and the second-order intermodulation products (f1 f2 , 2f1 , f1 +f2 and 2f2 ).
The graph also describes a relatively straightforward and widely accepted method of testing amplifier linearity. With this so-called "two-tone" method, two closely spaced fundamental signals (tones) are applied to the test amplifier. While the levels are often set at 6 dB below the 1 dB compression point, the preferred in-house method is to reduce the level of the two fundamental tones by 10 dB to preclude any possibility of gain saturation during the brief periods when the tones are in phase and the peak envelope power (PEP) is 6 dB above the level of either tone. By operating 10 dB down from the 1 dB compression point, 4 dB of compression margin is assured. The amount of IMD is given as 3IM and is by definition the level of the two "close-in" third-order intermodulation products relative to the two fundamental tones f1 and f2 .
A more convenient method of defining amplifier linearity is the so-called third-order intercept point (IP3 ). This method relies on a figure of merit that is determined by graphical extrapolation of amplifier data taken well below saturation.
Figure 2 shows a plot of the output vs. input transfer function of the hypothetical amplifier whose spurious response is shown in the previous frequency plot. Note that the desired fundamental outputs (f1 and f2 ) describe a function with a slope of one (m = 1). The output level continues to increase with an increase of input power until a point is reached where output device current limiting results in a gradual roll-off of output power. The point at which the fundamental output differs from the ideal level by 1 dB is defined as the 1 dB compression point. The third-order intermodulation products are also shown in the plot. They are much smaller than the fundamental tones, but have a slope of three (m = 3). The IP3 is a theoretical point obtained by extending the two functions until they intersect. At this point the spurious third-order intermodulation products have reached the level of the fundamental output tones. It must be noted that IP3 is not a measured value, but derived graphically. Amplifier test data is taken well below the 1 dB compression point to establish the two curves (fundamental and the third-order intermodulation curve) and the curves are extended until they intersect. The intersection point is by definition the third-order intercept point (IP3 ). In practice, amplifiers reach total saturation long before the two curves converge. Nevertheless, IP3 is a useful figure of merit. What is particularly interesting is its relationship with actual power levels as seen in the equation
|
|


where
Power(f1+f2) = power in each fundamental signal, f1 and f2 (note that f1 = f2 )
In actual practice, to measure 3IM, the two fundamental tones are set at a level of 10 dB below the 1 dB compression point of the amplifier. Thus
Power(f1+f2) =
P0(@1 dB compression) 10 dB
where
P0 = output power at the 1 dB compression point the amplifier
Solving equation 2 for the third-order IMD
3IM = 2(IP3 Power(f1+f2) ) (3)
The above equations allow for the practical application of IP3 to "real life" system requirements. Data sheets generally provide IP3 values for linear amplifiers. Given an IP3 , test operators can predict the third-order intermodulation products (IM3) for a given output power, or conversely, can specify a required IP3 for a required output power and allowable distortion (3IM). Lacking manufactures IP3 data, a rule of thumb for a class A linear amplifier is that IP3 is approximately 10 dB greater than the 1 dB compression point.
Table 2 summarizes the output power specs and actual IP3 for the S-series microwave amplifiers, as well as the predicted IP3 for a typical class A linear amplifier. Note that the actual IP3 figures are on average 4 dB better than expected. The company has worked closely with telecommunications providers to develop this line of microwave amplifiers that have been optimized for wireless test applications. Proprietary techniques have been developed to improve noise and linearity to decrease adjacent channel interference or what is commonly referred to as adjacent channel power (ACP). The end result is more efficient use of the small slices of frequency spectrum used in analog frequency division multiple access, digital TDMA and GSM technologies, and less spectrum regrowth when applied to spread spectrum technologies used in CDMA and W-CDMA. Spectrum utilization is of paramount importance in wireless applications and spurious signals that reduce the available spectrum must be minimized. Irrespective of the multiple-access encoding scheme used, IP3 is a good predictor of linearity as well as spectrum regrowth,2 and can be used to determine the applicability of a particular amplifier for use in a wireless test application.
|
|

CONCLUSION
The S-series microwave amplifiers exhibit low noise and distortion characteristics required of wireless test amplifiers. The very broad frequency bandwidths address all the higher frequency wireless applications from cellular telephone to the emerging Bluetooth technology to the latest 50 MHz slice of spectrum that has extended wireless to 3700 MHz. In addition to an average IP3 improvement of 4 dB designed into these amplifiers, the unique circuit design of the S-series has been shown to yield an additional 3 dB improvement in IP3 when a very simple operational technique is applied. This technique in effect results in a degree of predistortion of the input signal. Additional information can be obtained from the application engineering department at the number listed below.
References
1. Federal Communications Commission news release: "FCC Allocates Additional Spectrum for Wireless Services," Oct. 24, 2000.
2. Q. Wu, H. Xiao and F. Li, "Linear RF Power Amplifier Design for CDMA Signals: A Spectrum Analysis Approach," Microwave Journal, Vol. 41, No. 12, Dec. 1998, pp. 2240.
Amplifier Research,
Souderton, PA (800) 933-8181.
Circle No. 300