The mmWave frequencies being planned for 5G systems pose challenges for channel modeling. At these frequencies, surface roughness impacts wave propagation, causing scatter in non-specular directions that can have a large effect on received signal strength and polarization. To accurately predict channel characteristics for millimeter wave frequencies, propagation modeling must account for diffuse scattering effects. Wireless InSite’s diffuse scattering capability is based on Degli-Esposti’s work. It includes three models that provide alternative scattering patterns and account for partial cross-polarization of the scattered fields. It also allows the user to optionally sum scattered contributions assuming coherent phase, so that phase effects over closely-spaced antennas (e.g., MIMO) can be accounted for.
This example uses Wireless InSite’s diffuse scattering capability to perform simulations of an indoor wireless network and compares to some measurements detailed in.1 The scenario, shown in Figure 1, is a portion of the 9th floor of an office building, which includes walls, pillars, windows, cubicle partitions, desks and cabinets. The transmitter is located at ceiling level in a large, open room. The receivers are located at several points in the room and down the hallway.
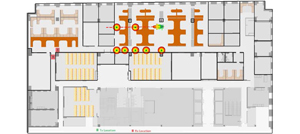
Figure 1a
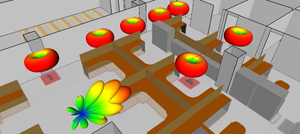
Figure 1b
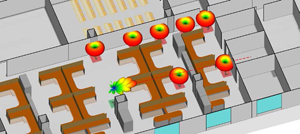
Figure 1c
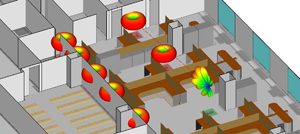
Figure 1d
Figure 1: Various positions of transmitting horn antenna aligned with various receiver points
We focus on the measurements done at 73.5 GHz in the large room nearest the transmitter. The transmitter is modeled using a horn antenna pattern with 15° beam width and 20 dBi gain that is rotated to point at each receiver location. The receivers are mounted 1.5 m above the floor in several locations, both within line-of-sight, and beyond line-of-site from the transmitter. Each receiver is modeled with both a vertical and horizontal 45° beamwidth Omnidirectional antenna.
The diffuse scattering effects of the floor, drywall walls, pillars, filing cabinets, cubicle partitions, and desk supports are modeled using the directive model described in.4-6 With this model, scattered energy is centered around the specular reflection angle with no back scatter. The Scattering Factor, S, represents the fraction of the incident electric field that is scattered diffusely. Valid values range from 0, no diffuse scattering, to 1, all diffuse scattering. The cross-polarization fraction K-xpol represents the fraction of diffuse power that becomes cross-polarized relative to the incident ray’s polarization. Valid values range from 0 to 0.5. Lastly, the parameter alpha controls the shape of the forward-scattering lobe. Valid values are integers between 1 and 10, with 10 being the narrowest. Figure 2 shows how energy is scattered when using the directive diffuse scattering model.
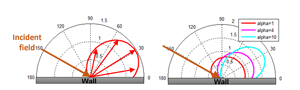
Figure 2: Directive diffuse scattering model
Recommended values for the Scattering Factor at 60 GHz range from 0.1 to 0.5.2 Table 1 shows the Scattering Factor used for each of the diffuse scatter enabled materials in this example. Material properties for the drywall, concrete (floor, ceiling and pillars), glass windows and desktops are taken from.2 The cubicle partitions are assumed to be Fiber Reinforced Plastic (FRP) honeycomb core, and their properties are extrapolated from.3 The filing cabinets and other metal structures are assumed to have handles, beveled edges, and other structures that can contribute to scattering. Cross-pol fraction and alpha were left at the Wireless InSite default values of 0.4 and 4 respectively.
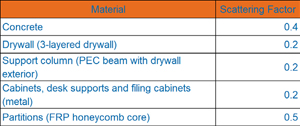
Table 1: Scattering Factor for various building materials
Two study areas are created to allow for easy comparison of non-diffuse scatter results and results with diffuse scattering. For the non-diffuse scattering interactions the settings are 3 reflections, 1 transmission and 1 diffraction. For the diffuse scattered paths, we allow 1 reflection, no transmissions and 1 diffraction. The ability to allow interactions along the diffuse scattering paths is unique to Wireless InSite.
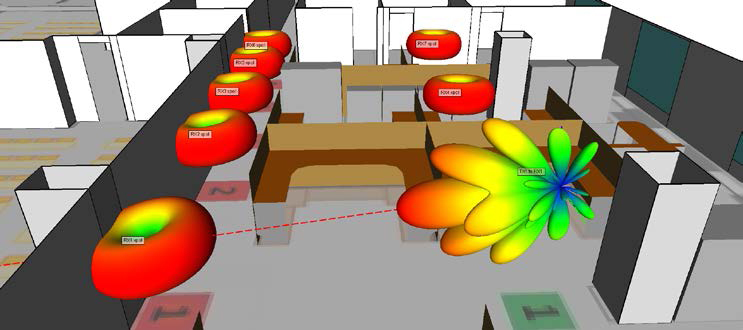
Figure 3: Various positions of transmitting horn antenna aligned with various receiver points
To replicate the measurement procedures described in,1 it is necessary to align the transmitter’s antenna with the intended receiver, and consider only the intended, paired channels. This was done by creating seven transmitters at the location for transmitter 1, each with the horn antenna rotated to align with the intended receiver location. Figure 3 shows the antenna alignment for receiver locations 1, 4 and 5.
The aligned pairs are most efficiently run by selecting and making active; for example, TX1 to RX1, RX1 and RX1-xpol, running the simulation, then moving on to TX1 to RX2, RX2, and RX2-xpol, etc. Running the simulations in this manner requires a little over a minute for each specular case, and about four minutes for each diffuse scatter simulation.
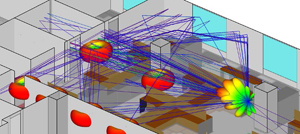
Figure 4a: Specular propagation paths to RX7
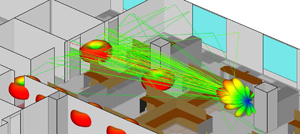
Figure 4b: Paths include diffuse scatter to RX7
Figure 4a and b show the top 100 paths between the matched TX- RX pair for the receiver location 7. The red paths are the strongest, with weaker paths rendered in greens and blues. The specular paths in Figure 4a show the highest power paths are typically within the main beam, with many lower powered reflections and transmissions off and through the walls. Figure 4b includes paths with diffuse scattering interactions. One can see the wide spread of paths scattering backwards off the wall behind the receiver. Other non-specular interactions off the pillars and partitions are also apparent. The range in power of these paths is less dynamic than for the specular-only paths.
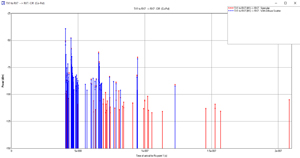
Figure 5a: Co-polarized Complex Impulse Response for RX7 with and without diffuse scattering
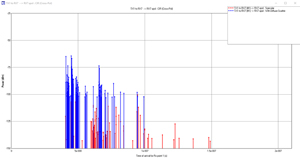
Figure 5b: Cross-polarized Complex Impulse Response for RX7 with and without diffuse scattering
Alternatively, the Complex Impulse Response (CIR) shows the power of each path as a function of its arrival time. Figure 5a and b show the CIR for RX7, for co-pol and cross-pol respectively. The specular-only results are plotted in blue, while the red results include diffuse scattering effects. The diffuse scatter results show more smearing, with arrival times occurring very close together, while the specular results are more discrete and spread out.
The relevant path loss output files for comparison to measured data are listed in Table 2. A copy of these has been saved to the Aligned Antennas folder within the project. In addition, the simulated path loss results have been collected into four files for simpler plotting: Aligned_specular_CoPol.plt, Aligned_specular_XPol.plt, Aligned_DS_CoPol.plt, and Aligned_DS_XPol.plt
Plot files for the measured results presented in1 are located in the measurement folder. They can be plotted against the Wireless InSite data by importing their plots.

Table 2
Figure 6a and b below show Wireless InSite predictions for path loss vs. distance for the seven receiver locations for the co-polarized (V-V) case and the cross-polarized (V-H) case. The red line shows path loss for specular paths only, and the blue line represents path loss with diffuse scattering.The measured results presented in1 are shown in green. These plots show that diffuse scattering has a much greater impact on the cross-polarized results and is critical for providing accurate predictions.
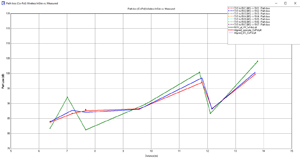
Figure 6a: Co-polarized TX/RX path loss - simulation with and without diffuse scattering compared to measured
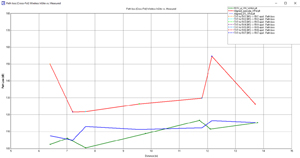
Figure 6b: Cross-polarized TX/RX path loss - simulation with and without diffuse scattering compared to measured
References
- G. MacCartney, T. S. Rappaport, S. Sun and S. Deng, “Indoor Office Wideband Millimeter-Wave Propagation Measurements and Channel Models at 28 and 73 GHz for Ultra-Dense 5G Wireless Networks,” IEEE Access, Vol. 3, December 2015, pp. 2388-2424.
- "Effects of building materials and structures on radiowave propagation above about 100 MHz," Recommendation ITU-R P.2040-1, July 2015.
- A. Von Hippel and W. B. Westphal, "Tables of Dielectric Materials, Volume V, Final Report," Laboratory for Insulation Research, Massachusetts Institute of Technology, Cambridge, Mass., April 1957.
- V. Degli-Esposti, F. Fuschini, E. M. Vitucci and G. Falciasecca, “Measurement and Modeling of Scattering from Buildings,” IEEE Transactions on Antennas and Propagation, Vol. 55, No. 1, January 2007, pp. 143-153.
- V. Degli-Esposti, “A Diffuse Scattering Model for Urban Propagation Prediction,” IEEE Transactions on Antennas and Propagation, Vol. 49, No. 7, July 2001, pp. 1111-1113.
- V. Degli-Esposti, V. M. Kolmonen, E. M. Vitucci and P. Vainikainen, “Analysis and Modeling on co- and Cross-Polarized Urban Radio Propagation for Dual-Polarized MIMO Wireless Systems,” IEEE Transactions on Antennas and Propagation, Vol. 59, No. 11, November 2011, pp. 4247-4256.
- J. Pascual-Garcia, et. al., “On the Importance of Diffuse Scattering Model Parameterization in Indoor Wireless Channels at mm-Wave Frequencies,” IEEE Access, February 2016.