
A common performance measure of radio communication systems is the carrier-to-interference ratio (CIR). A new method for estimating the total CIR degradation by a nonlinear device is presented in this article. Using a kernel function derived from swept power two-tone intermodulation distortion (IMD) measurements, the CIR of a nonlinear device may be determined for any arbitrary input signal. For experimental validation, the estimated CIR is compared to measured results of the output signal CIR of a 1.9 GHz nonlinear amplifier fed by a CDMA signal over a range of power levels.
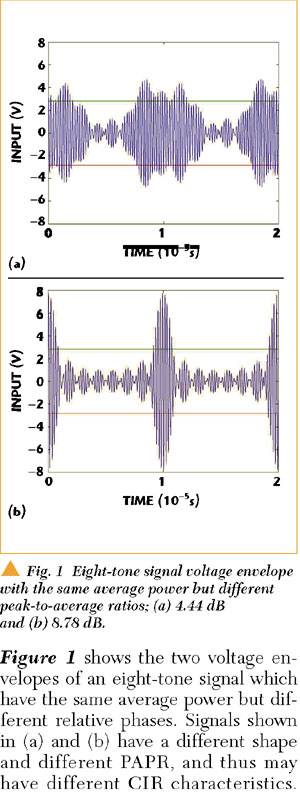
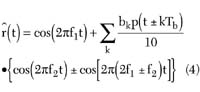
Microwave devices used in communication system components, such as power amplifiers, often have nonlinearity. Due to the nonlinear characteristics, the modulation sidebands interact and produce intermodulation distortion (IMD). Thus interference may be created through IMD within the transmission system that will degrade bit error rate at the receiver. To evaluate the amount of interference compared to carrier, the CIR is used. CIR is usually defined as the total power within the carrier (or group of the carriers) divided by the total interference power (that is, the total power attributed to the IMD products within the transmit band). Traditionally, two-tone IMD measurement analyses has been used to analyze nonlinear effects in power amplifiers. In this case, the CIR is defined as the level of IMD products below the level of the two carriers. However, the signals that occur in actual system use may have a much different distribution of instantaneous envelope power to the average power compared to that of two-tone test signals. In particular, the peak-to-average power ratio (PAPR) of the signals may be much different even though the signals have the same average levels. This leads to gross errors in prediction of CIR from that predicted by two-tone IMD. Figure 1 shows the two voltage envelopes of an eight-tone signal which have the same average power but different relative phases. Signals shown in (a) and (b) have a different shape and different PAPR, and thus may have different CIR characteristics. The PAPR distribution discrepancy between a two-tone signal and the digitally modulated signals was previously published.2
This article provides a new method to calculate CIR for arbitrary signals using two-tone IMD measurements and a PAPR distribution of input signals. The foundation for the method developed is the extraction of the function called the intrinsic CIR (ICIR) kernel function that represents the IMD produced by a small incremental deviation in signal amplitude.
CIR ESTIMATION METHOD
The CIR estimation method proposed in this article rests on the extraction of a behavioral model that is the ICIR kernel function. Physically, the ICIR kernel represents the IMD produced by a small incremental deviation in signal amplitude. It is first postulated that the CIR at an average output power level p_ of an output signal from a nonlinear device is related to the ICIR function through a weighted average given by
where
ICIR(p) = value of the kernel function at the instantaneous envelope power p
fP (p/ ) = probability density function (PDF) of the envelope power (relative to the average power )
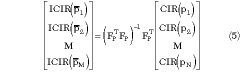
Thus to compute the CIR of any input signal, all that is required is the ICIR of the device and the PDF of the input signal. The PDF can be found either through analytic calculation or through measurements of the signal histogram. Assuming that the ICIR function is known from measurements at discrete power levels p_i , Equation 1 may be represented in discrete form as
This expression can be rewritten in matrix form as
where
is the matrix of probability densities at the given power levels. Pr[p = pk / ] can be calculated from the input signal by calculating a histogram at each average power level i . Assuming that the statistics of the input signal do not change as the mean value of envelope power increases, it is seen that all of the rows of FP are identical replicas of the first row, but stepped out in average power by iΔ . The procedure to determine the FP matrix using the histograms is given in the next section. Thus, once the ICIR of a device and FP for any given signal is known, the CIR function can be obtained from Equation 3.
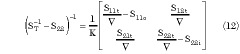
While CIR and FP may be measured for a given device and signal, respectively, the values of the ICIR function are difficult to obtain directly. It must be noted that, even if N = M, the FP matrix in Equation 3 would not be easily inverted, as the matrix is close to singular due to the similarities between rows. Furthermore, it is necessary that the ICIR vector be calculated over the desired range of average input power level plus PAPR of the arbitrary input signal. Thus, ICIR function over a range of average power levels can be calculated in least squares form as
Thus, if the values of the CIR for a two-tone test signal are known at N discrete power levels, the value of the ICIR kernel can be extracted using Equation 6. Once this is done, the CIR over a range of average power levels i can be calculated from Equation 3.
FP MATRIX GENERATION
The PDF of an input signal power, denoted by fP (p), is defined as the derivative of the cumulative density function (CDF). From the definition of PDF, it can be interpreted for small Δp as

The value of the PDF at a given point p is calculated by histograms. In that case the PDF function specifies how much probability mass exists around that point. The histograms of the input signals are easily acquired by actual measurements. A measure of input power is repeated n times during one time period. The signal powers at time t1 , t2 ,..., tn are observed and the values
P1 = P(t1 ), ..., Pn = P(tn ) (7)
are measured.
Supposing there are finite measurements {Pi }ni=1 , the value of the PDF at any given power p can be approximated with the probability that the random variable P lies in the interval (p,p + Δp]. To connect the PDF with the input power measurement {Pi }, Pr[p < P ¾ p + Δp] can be evaluated as a relative frequency. To do that, first the maximum power measurement value Pmax and the minimum power value Pmin (usually 0) must be determined in the measurement set, that is,

Second, the interval [Pmin ,Pmax ] is partitioned into K bins. Given a desired number of bins K, Δp can be calculated as

Inversely, given a desired length of Δp, the number of bins K can be calculated as

With Δp fixed, let m(p) denote the number of the input power such that
p < Pi ¾ p + Δp, i = 1, ..., n (11)
Then m(p)/n is the desired relative frequency, and thus the approximation is
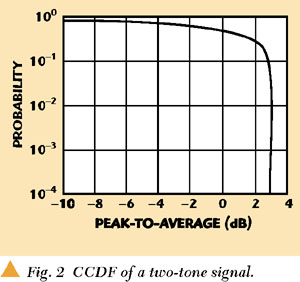
Using this method, the PDF function of a two-tone signal can be derived. Figure 2 shows the complementary CDF (CCDF) function of a two-tone signal for PAPR using this method.
This histogram algorithm can be extended to get FP . FP is calculated from N signal power probability distribution functions derived from the signals which have different average power i (i = 1,...,N) stepped by Δp. For the FP matrix, it is necessary to determine the same Δp and K bins for N input signals. For this condition, Pmax and Pmin must be determined in the overall measurements. The probabilities add to 1 and are never negative. Thus, the two fundamental properties of the FP matrix are as follows: each row adds to 1 and no entry is negative.
TWO-TONE IMD MEASUREMENT
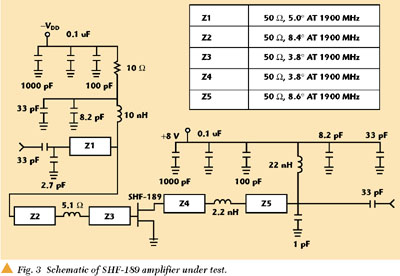
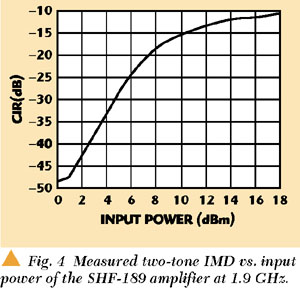
Figure 3 shows a schematic of the test circuit, which is a 0.5W GaAs/AlGaAs HFET power amplifier. The SHF-189 device and PCB board were supplied by Stanford Microdevices.4 The nominal small signal gain is approximately 15.8 dB. The circuit is biased with a quiescent drain current of 250 mA at 8 V VDS . Under these conditions, the output power at 1 dB gain compression was measured to be +25.4 dBm. A driver amplifier with approximately 7 dB gain preceded the SHF-189 amplifier stage. In this measurement, it was confirmed that the driver amplifier did not significantly contribute to the output CIR. Two-tone IMD measurements were made at 1.9 GHz, with a tone spacing of 1.25 MHz over an input power range of 25 dB that extends from the small-signal region to well beyond P1dB. All significant IM products are added to evaluate the total interference power. It is seen that the slope of IMD vs. input power for input levels is greater than 2:1 (as would be expected for a class A amplifier) in the region below output saturation. Figure 4 shows the measured two-tone IMD.
ICIR FUNCTION AND CDMA CIR PREDICTION
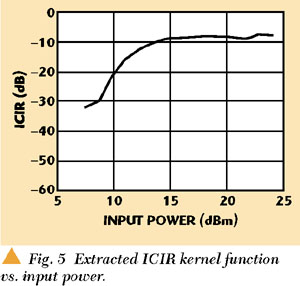
The ICIR function was extracted from the two-tone IMD data using a PDF for the two-tone signal. A plot of the ICIR function is shown in Figure 5. It was previously verified1 that this function is not dependent on the input signal used for the extraction. The ICIR function has a sharper saturation than the two-tone CIR. This result would be expected, as the PAPR for a signal that would directly calculate ICIR would have to be much smaller than the 3 dB PAPR of a two-tone signal.
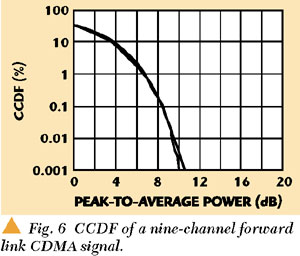
The PAPR distribution of a CDMA signal that has nine forward channels (six traffic, pilot, sync and paging channels) can be obtained from the CCDF plot from an Agilent E4432B signal generator. CCDF characterizes the peak power statistics of a digitally modulated CDMA signal, as shown in Figure 6. The peak excursion of the signal above average is seen to be approximately 9.5 dB at a 0.01 percent probability. The PAPR distribution matrix of CDMA signal is formed in the same manner previously described. The CDMA CIR can be calculated using Equation 3 for a range of power levels. The results of this calculation indicate that the CDMA CIR is 5 to 15 dB worse than the two-tone CIR at comparable power levels. This is attributed to the higher PAPR of the CDMA signal.
CDMA CIR MEASUREMENT AND COMPARISON
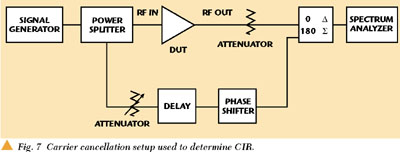
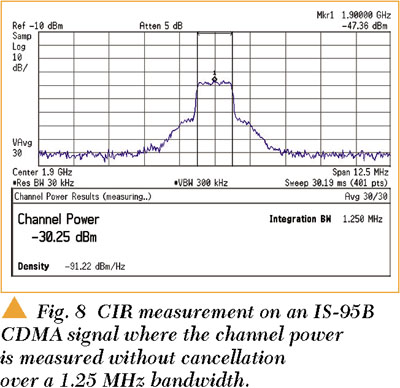
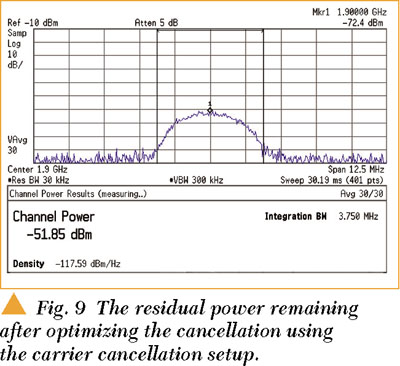
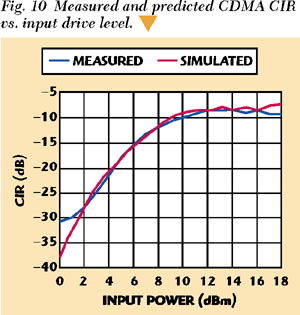
The test set up shown in Figure 7 was assembled to measure the total interference power produced by a nonlinear device under test (DUT). A similar set up was previously described.5 Because much of the interference power occurs within the bandwidth of the modulated signal, the undistorted portion must be eliminated to accurately determine the amount of the interference power. This is similar to a carrier cancellation loop in a feed-forward linearized power amplifier.3 Figure 8 shows the DUT output signal spectrum (integrated to measure the carrier power) and Figure 9 shows the extracted interference signal spectrum (integrated to measure the interference). The resulting CIR vs. input power is shown along with the predicted CIR in Figure 10. It is seen that the agreement is within 1 dB over a 14 dB range of input power level. The discrepancies at low power levels are attributed to an inaccurate two-tone CIR due to the limited dynamic range of the set up. At higher levels, the CDMA CIR begins to deviate from the measured CIR as the signal peaks extend beyond the range of the extracted ICIR kernel function.
CONCLUSION
A new behavioral modeling approach was developed to calculate the CIR for any input signal applied to a nonlinear microwave component. The method consists of extracting the ICIR kernel function from the nonlinear device excited by a two-tone signal, or any signal with known power envelope statistics. Using this function, the CIR of the device driven by an arbitrary input signal of known statistics can be obtained. In addition, experimental validation of a new method of estimating CIR degradation of an arbitrary signal passing through a nonlinear device was presented. The ICIR kernel function for a GaAs/A/GaAs HFET power amplifier was derived using two-tone measurements. Using the ICIR and the CCDF function from a signal generator, the CIR for a CDMA signal was predicted. Better than 1 dB agreement was obtained when predicting the output CIR of a nonlinear amplifier with a CDMA input signal over a 14 dB range of input power.
ACKNOWLEDGMENT
This work was supported in part by the Yamacraw Project (http://www.yamacraw.org), an economic development initiative sponsored by the state of Georgia. This work was partially supported by grants from the Office of Naval Research and the National Science Foundation. The material for this article was first presented at the RAWCON2000 IEEE Radio and Wireless Conference held in Denver, CO in September 2000. *
References
1. H. Ku, A. Leke and J.S. Kenney, "Prediction of Output Carrier-to-Interference Ratios From Nonlinear Microwave Components Driven by Arbitrary Signals Using Intrinsic Kernel Functions," RAWCON2000, Denver, CO, September 1113, 2000, pp. 191194.
2. J.S. Kenney and A. Leke, "Power Amplifier Spectral Re-growth for Digital Cellular and PCS Applications," Microwave Journal, Vol. 38, No. 10, October 1995, pp. 7492.
3. S.C. Cripps, RF Power Amplifiers for Wireless Communication, Artech House, 1999.
4. Stanford Microdevices Inc., 522 Almanor Drive, Sunnyvale, CA, 94086, http://www.stanfordmicro.com.
5. J.C. Pedro and N.B. Carvalho, "A Novel Set-up for Co-channel Distortion Ratio Evaluation," 2000 International Microwave Symposium Digest, Boston, MA, June 1316, 2000.
 Hyunchul Ku received his BS and MS degrees from Seoul National University, Seoul, Korea, in 1995 and 1997 in electrical engineering, and is currently working toward his PhD degree in electrical and computer engineering at the Georgia Institute of Technology. From 1997 to 1999 he was a member of the Technical Staff at Korea Telecom, Wireless Research Center, Seoul, Korea. His research interests include behavioral modeling of RF devices, amplifier linearization and statistical signal processing.
 Wangmyong Woo received his BS degree in computer engineering from Myong Ji University, Korea in 1998. In 1999 he began graduate study in electrical and computer engineering at the Georgia Institute of Technology. He is working on RF power amplifier linearization problems as a PhD candidate. His research interests are in RF power amplifier linearization and cellular personal communication systems.
 J. Stevenson Kenney (S '84, M '85) completed his BSEE (Hons.) in 1985 and MSEE in 1990, both from the Georgia Institute of Technology. In 1994 he completed his PhD in electrical engineering, also at Georgia Tech. In January 2000, Dr. Kenney joined the faculty at the Georgia Institute of Technology, where he is Associate Professor in electrical and computer engineering. He is currently teaching and conducting research in the areas of RFIC design, communication systems design and high frequency simulation techniques. Dr. Kenney also has over 14 years of industrial experience in wireless communications. He has held engineering and management positions at Electromagnetic Sciences, Scientific Atlanta and Pacific Monolithics. Prior to returning to Georgia Tech, Dr. Kenney was Director of Engineering at Spectrian Corp., Sunnyvale, CA. Dr. Kenney has been an active member of IEEE Microwave Theory and Techniques Society for 14 years. Dr. Kenney has authored or co-authored more than 25 technical papers and conference presentations in the areas of acoustics, microelectronics, microwave design and telecommunications. He currently serves on the Editorial Board for the Transactions on Microwave Theory and Techniques and the Microwave and Wireless Components Letters, and serves on the IMS Technical Program Committee. Dr. Kenney is currently serving as co-chair of the RF Components technical interest group of the National Electronics Manufacturing Initiative.