

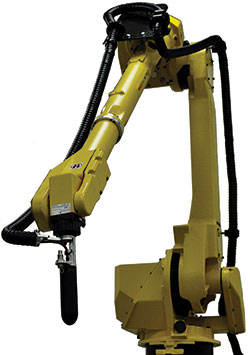
Figure 1 Robotic arm with microwave probe sensor and flexible RF cable along the arm.
Traditionally, RF material measurements have been dominated by the paradigm of taking samples into the laboratory. This is because of the historically large size of both the microwave analyzer equipment and the fixturing. Recent technology developments in both compact spot probes and compact microwave analyzers are enabling a reversal of this paradigm. This article discusses the concept of handheld or robot mounted reflectometers for in situ measurement of microwave relevant materials. The technology described integrates the microwave analyzer and sensor, eliminating the need for RF cables.
Measuring the performance of microwave materials requires a test apparatus that includes a measurement fixture and a microwave analyzer, which are usually connected with microwave or RF cables. These cables are the bane of many measurement scenarios and can be significant sources of measurement error. A lesson learned early in material measurement laboratories is to avoid bumping the RF cables because of the phase and amplitude errors that result. To address this, some RF cable manufacturers include polymer outer jackets with increased surface stickiness to minimize movement when the cable is inadvertently bumped.
Even if cable flex errors are carefully controlled, environmental temperature drift can cause substantial errors. RF cables are generally a coaxial design, with solid or stranded inner and outer conductors made from metal and separated by a dielectric spacer. Teflon is commonly used for the spacer and is subject to thermal expansion or contraction as the temperature changes. With Teflon, a material phase transition occurs near room temperature that significantly increases its thermal expansion coefficient. In the RF measurements industry, this is known as the “Teflon knee.”1 Because of this, RF cables experience sufficient thermal expansion to cause undesired phase drift with just a couple degrees of ambient temperature change. Surprisingly, temperature variation due to normal air-conditioning cycles can cause significant measurement errors as well.
These problems are exacerbated when material measurements are required in a factory or production environment. The usual paradigm in a materials measurements laboratory is to insert a material coupon into a measurement apparatus. Conversely, in a factory, the need is to measure materials in situ, requiring that the measurement apparatus be located at the production line where the part is being manufactured. For example, measurement of materials that are incorporated in a large component such as a microwave radome may require robotic actuation of a sensor over the surface of the structure. Traditionally, this requires that the RF cable connecting the sensor to the analyzer be routed along the robot arm. As the sensor is moved over the part being tested, the cable flexes and creates phase and amplitude errors that are not necessarily repeatable. The RF cable is also subject to wear and must be replaced, as continuous motion eventually results in cable failure. Depending on the production environment, ambient temperatures may vary more than in an air-conditioned laboratory, further increasing measurement errors.

Figure 2 Measured reflection from a metal-backed absorber showing software correction of cable movement errors.
SOFTWARE SOLUTION
One potential solution for reducing cable-induced errors is through software analysis of the measured data. This requires quantifying the phase and amplitude errors induced by the cable, then applying a correction to the measured signal to cancel the cable error. In a recent provisional patent, Compass Technology Group described such a method.2 It uses the extra reflections that exist within a measurement apparatus that are usually ignored or subtracted.
To illustrate this idea, Figure 1 shows a microwave spot probe attached to the end of a robotic arm. A microwave network analyzer (not shown) excites the apparatus from 2 to 20 GHz. A 7.5 m RF cable that connects the network analyzer to the microwave probe is contained within a flexible cable management tube, to protect the cable from excessive wear. During operation, the robot positions the spot sensor just above the surface to be measured. The signal of interest is the energy that is emitted from the probe and reflected by the material beneath it. However, the probe also reflects some of the microwave energy, an otherwise unwanted reflection from the probe that can serve as a phase and amplitude reference signal. Any change in the phase and amplitude of the probe antenna provides a measurement of the phase and amplitude offset due to cable flex.2 These offsets are applied before the calibration calculation, which minimizes them as error sources.
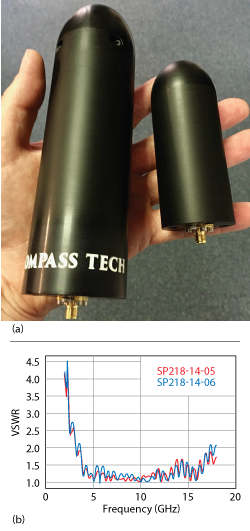
Figure 3 Large and small spot probes (a) and large probe typical VSWR (b).
Measured data from an electromagnetic interference (EMI) absorber (see Figure 2) illustrates the effects of cable flex. This material is designed to maximize absorption near 14 GHz. The data shown in this figure is calibrated using a “response and isolation” methodology.1 The response measurement is of an ideal microwave reflector, in this case a flat metal plate. The isolation measurement is with no specimen (i.e., free space). The calibration procedure includes a vector subtraction of the isolation measurement from both the response data and the specimen measurement. When the additional cable correction method is used, the phase and amplitude correction is applied before each vector subtraction step: the isolation measurement is subtracted from the corrected specimen-under-test data and from the corrected response data, as appropriate. The final calibrated reflectivity of the specimen is then the ratio of the subtracted specimen data to the subtracted response data.
Figure 2 illustrates the care needed to avoid moving the RF cable between calibration and specimen measurements. The green line shows the baseline reflection from a metal-backed absorber before any movement of the connecting cable. The red line shows the same specimen measured after the RF cable is moved and without any phase or amplitude correction. The dashed blue line shows the specimen measurement after the cable is moved and with the phase and amplitude correction using the method described. The corrected data after cable movement overlays the calibrated data for the undisturbed cable. As these results show, cable movement significantly degrades the accuracy of an RF measurement, and this correction method can account for these errors.
CABLE-LESS HARDWARE
While the use of a software algorithm to reduce cable errors is helpful in most situations, it does not eliminate the practical limitations of RF cables. Cables still wear out in measurement systems where motion is necessary, and cables can degrade to the point where no amount of software correction will correct the phase and amplitude errors. The ultimate solution to dealing with RF cables is to eliminate them. A couple decades ago, microwave analyzers were very large and heavy, occupying full-sized racks. Their size has been steadily reducing since then, with network analyzers from several companies now down to a single, rack-mounted component. However, even these are relatively big and heavy, requiring the sensor to be connected with an RF cable. The significant advances in compact microwave circuitry and components—driven by the constant drive for the miniaturization of RF transceivers in consumer electronics—led to the development of ultra-compact lab-grade vector reflectometers that are now commercially available. With a form factor that easily fits in the hand, these analyzers make RF cable-less measurements feasible.3
Cable-less RF measurements are especially powerful because they eliminate the errors previously discussed. More importantly, they enable a shift in the paradigm of RF material measurements. With conventional-sized microwave equipment, “witness” coupons must be made and brought to the measurement apparatus for testing. RF analyzers not much bigger than a cell phone provides a new capability to measure materials and components in situ, eliminating the need for witness coupons. This brings accurate and precise material measurements out of the laboratory and into the much more challenging environment of the factory floor. An added benefit is separating the microwave measurement from data processing on a separate PC, which minimizes the amount of work performed on the factory floor and improves productivity.
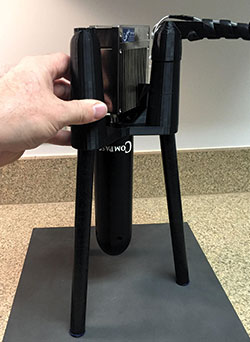
Figure 4 Integrated 2 to 18 GHz reflectometer system including both sensor and vector analyzer.
A key ingredient for handheld measurements is a compact RF sensor or spot probe. The use of spot probes for microwave material measurements goes back to at least the mid-1970s. Musil, Zacek et al. used dielectric antennas to measure transmission through a material specimen and their sensors consisted of dielectric rods inserted into the ends of metal horn antennas.4 They used their sensors to successfully determine the complex dielectric permittivity of silicon specimens at mmWave frequencies. More recently, Diaz et al. designed “polyrod” antennas using computational simulation tools; their sensor included multiple dielectric layers inserted into a metal horn antenna,5 and their innovation used computational tools to optimize the inserted polymer material and the impedance match of the probe antenna.
The spot probe described in this article includes both metallic elements and dielectric material. While previous spot probes used dielectric material inserts in conventional horn antennas, this compact probe design optimizes both the dielectric shape and metallic elements within an integrated unit (see Figure 3a). Fed by a single SMA port in the rear, the larger model transmits and receives with linear polarization from 2.5 to 20 GHz; the smaller model covers 4 to 24 GHz. The two probes are 18 cm and 10.2 cm long, respectively. Figure 3b shows the VSWR for two different large probes; the VSWR is lower than 3:1 for the entire frequency band and lower than 2:1 for most of the band. The smaller probes have similar VSWR characteristics, except they extend to higher frequencies. These probes have measurement accuracies similar to larger laboratory measurement systems when measuring materials at normal incidence.6 The illumination area is approximately round and has a diameter that depends on both standoff distance and frequency. For the measurement examples discussed in this article, a standoff distance of approximately 7 cm is used, and the illumination area diameter is approximately 5 cm at 10 GHz; the diameter is larger at lower frequencies and smaller at higher frequencies within the band.
APPLICATION EXAMPLES
This section reviews the use of a miniaturized analyzer that has been integrated with this spot probe sensor. Two examples are presented: 1) monitoring the reflectivity of materials used in EMI mitigation using a handheld device and 2) non-destructive detection of defects in fiberglass composites with robotic scanning.
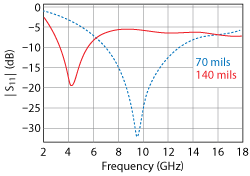
Figure 5 Reflection data from the hand-held system (spot probe and vector analyzer) showing reflectivity of magnetic absorber material.
Material Reflectivity
The proliferation of high speed computing and wireless communications has crowded the electromagnetic environment. Signals generated within a device or between devices can inadvertently interfere with their functionality. One technique for reducing this mutual interference is using materials to block or absorb signals. For example, the housing for a component may be lined with or have embedded materials to absorb RF energy. An active component may have absorbing material directly applied to it to minimize interference. Screens designed to block and absorb energy may be placed between adjacent components.
Figure 4 shows an integrated reflectometer that includes a Copper Mountain Technologies RP180 vector analyzer and a Compass Technology SP218 spot probe. This system is handheld and only requires cables for power and USB communication with a data acquisition computer. Calibration of this device is straightforward and requires only two measurements: a “response” measurement and an “isolation” measurement. The response measurement uses a reference standard such as a flat metal plate. The isolation standard is simply measuring the probe while it is pointed at free space. This isolation measurement allows subtraction of background and foreground signals from the signal of interest, including the probe response. Time domain processing is used to further isolate the signal of interest from other unwanted signals, such as room reflections. Time domain processing transforms the wideband frequency data into the time domain and isolates the reflection of the sample under test from the rest of the detected reflections.
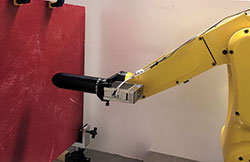
Figure 6 Robot arm with spot probe and vector analyzer scanning a fiberglass panel.
Figure 5 shows the measured data from two different absorber material samples measured by the reflectometer system shown in Figure 4. These specimens are of a commercial magnetic absorber material that is made by mixing iron particles with an elastomer. The iron loading and thickness of the 70 mil thick absorber enables it to optimally absorb at around 9 GHz, as shown by the data. A second curve shows the measurement of two 70 mil layers of this material, placed on top of each other to double the thickness. As a result, the reflection null occurs at a frequency nearly half that of the original absorber sheet. The compact size of this measurement system makes it conducive for use in factory environments where the materials are being manufactured, which is more convenient than having to bring specimens back to a laboratory for testing. Its portability enables it to be used when and where materials are applied to components or parts. While these measurements are of a magnetic absorber, the reflectometer can also measure the microwave performance of resistive materials, such as EMI shielding, and dielectric materials such as radomes and microwave windows.
Non-Destructive Evaluation of Composites
The modern factory is automated and industrial robots are commonly employed to improve production efficiency and quality. In this setting, direct measurements of manufactured components are desired for quality assurance (QA) and process feedback, so that defects are identified early in the process and manufacturing variation can be managed. Catching problems early saves cost. When manufacturing large or expensive parts, QA requirements may require characterizing every part produced. A compact reflectometer with integrated analyzer and spot probe enables this when integrated into factory automation systems. In this example (see Figure 6), the reflectometer is scanned over the surface of a material to map the positional dependence of microwave properties. Physics-based models can then be used to determine information about the material.
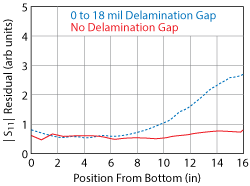
Figure 7 Detecting delamination in a fiberglass panel.
Composites are typically a laminate construction where different layers of fiberglass and resin, for example, are consolidated into a single material. Delamination is one problem that can occur during manufacturing or when using composite parts. For various reasons there may be air gaps or separations between layers within a part. Since fiberglass is generally opaque, there may be no visual indication of this delamination, and it only shows up when the part fails under mechanical load.
Figure 7 shows a measurement of a 0.5 in thick composite with and without a controlled delamination. The part consists of two 0.25 in thick composite panels sandwiched together. To simulate a delamination, an 18 mil spacer is placed at the top of the part. In both cases, with and without the spacer, the base of the panel is mechanically clamped together to eliminate any delamination gap at the base. The result shown in Figure 7 is calculated by comparing the measured reflectivity in the 2 to 18 GHz band to a single-layer model of a dielectric slab. The amount of deviation from the ideal slab model is plotted as a function of measurement location, while the robot scans from bottom to top. In both cases, there is a low level of residual model-fit error due to the natural inhomogeneity of the fiberglass. When a controlled delamination is induced in the middle of the specimen, the residual fit error shows a clearly increasing trend with the increasing width of the delamination gap.
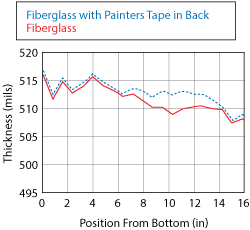
Figure 8 Computed thickness of a fiberglass panel, showing detection of painter’s tape.
A second example is shown in Figure 8, with an alternate analysis of reflection data measured from a composite panel. In this case, the measured data is also compared to a simple dielectric slab model. The dielectric composite permittivity is assumed to be known and constant. The model is then used to compute the thickness of the panel being measured based on this model-measurement comparison, with the y-axis the computed thickness. Consistent with physical caliper measurements, the thickness is approximately 0.5 in. Because the composite is not perfectly flat, there is some variability in the thickness as the reflectometer is scanned across the panel. The second curve in Figure 8, shows the measured data when a 6 in wide painter’s tape is applied in the rear part of the fiberglass panel, opposite to the side being measured by the reflectometer. As the data shows, the tape extends from about 7 to 14 inches and is clearly evident. The painter’s tape is approximately 3 mil thick, which is consistent with the increased thickness determined by the microwave reflectometer. Detection of this 3 mil thick layer is somewhat remarkable, considering the wavelength of the interrogating microwave energy: from 6 inches at 2 GHz to 0.66 inches at 18 GHz. This method can be used to detect small thickness changes in fiberglass composites and other dielectric materials. Furthermore, since it is easily portable, testing can be done in any environment, such as the factory or in the field.
SUMMARY
RF cables add errors due to thermal drift and flexing. Eliminating the RF cable, measurement reliability and accuracy are significantly improved. As RF cables wear out and must be replaced periodically, especially if they are regularly moved or flexed, eliminating the RF cable can decrease measurement cost and reduce the need for maintenance.
This article discussed two applications using a compact microwave reflectometer: The first used a handheld device to measure the reflection coefficient of absorber materials for EMI mitigation. In the second, an integrated reflectometer system was mounted on an industrial robot to scan fiberglass composites. With appropriate data processing, a microwave reflectometer can detect defects and determine the thickness of non-conductive materials. Both of the examples demonstrate that RF cable-less reflectometer technology is feasible, enabling in situ measurements in field and factory.
ACKNOWLEDGMENTS
This work was supported in part by a Cooperative Research and Development Agreement (CRADA) between the Air Force Research Laboratory (AFRL/RX) and Compass Technology Group.
References
- J. W. Schultz, “Focused Beam Methods,” Measuring Microwave Materials in Free Space, ISBN 1480092851, 2012.
- J. W. Schultz, R. Schultz, J. Maloney and K. Maloney, “Correction of Transmission Line Induced Phase and Amplitude Errors in Reflectivity Measurements,” U.S. Provisional Patent 20160103197, Issued February 16, 2017.
- S. A. Zaostrovnykh, V. I. Ryzhov, A. V. Bakurov, I. A. Ivashchenko and A. I. Goloschokin, “Measurement Module of Virtual Vector Network Analyzer,” U.S. Patent 9291657B2, Issued March 22, 2016.
- J. Musil, F. Zacek, A. Burger and J. Karlovsky, “New Microwave System to Determine the Complex Permittivity of Small Dielectric and Semiconducting Samples,” 4th European Microwave Conference, September 1974, pp. 66-70.
- R. Diaz, J. Peebles, R. Lebaron, Z. Zhang and L. Lozano-Plata, “Compact Broadband Admittance Tunnel Incorporating Gaussian Beam Antennas,” U.S. Patent 7889148, Issued February 15, 2011.
- J. W. Schultz, J. Maloney, K. Cummings-Maloney, R. Schultz, J. Calzada and B. Foos, “A Comparison of Material Measurement Accuracy of RF Spot Probes to a Lens-Based Focused Beam System,” Proceedings of the 2014 AMTA, October 2014.