
The Smith chart was introduced by Philip Hagar Smith in 1939 and then refined and extended several years before becoming an icon of microwave engineering. To have a finite and practical size, the classical 2D Smith Chart is constrained to the unit circle. Hence, loads with reflection coefficient magnitude greater than one cannot be plotted. In 2011, the 3D Smith chart was published by A.A. Muller, P. Soto, D. Dascalu, D. Neculoiu and V. E. Boria. The 3D Smith chart unifies the design of active and passive circuits with any magnitude of the voltage reflection coefficient on the sphere by keeping all the circle forms of the classical Smith chart unchanged, but its handling requires a spherical surface and thus a CAD tool (www.3dsmithchart.com) was developed in order to utilize it.
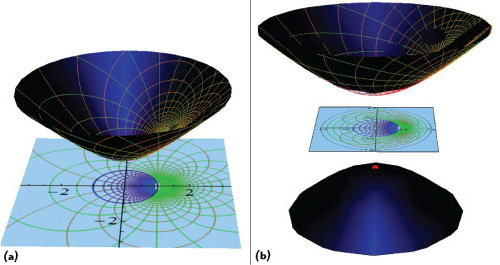
Figure 1 Preliminary construction: Generalized Smith chart mapped on the upper part of the two sheet hyperboloid (the upper sheet extends to infinity) (a) and stereographical mapping of the hyperboloid Smith chart in the unit disc from the red point (b).
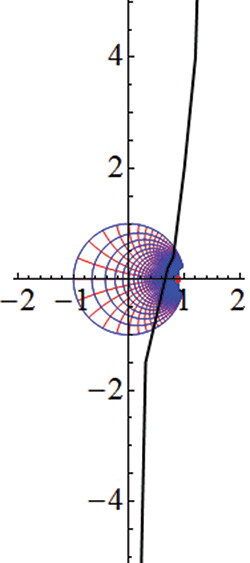
Figure 2 Input impedance (in black) of a microwave oscillator based on an Infineon bipolar transistor on the traditional Smith chart, the input impedance at the oscillation frequency is thrown towards infinity.
The creators of the 3D Smith chart have now extended the tool by using a hyperbolic Smith chart suitable for representing both circuits with negative and positive resistance with the magnitude of the voltage reflection coefficient ρof any possible value (0<ρ<∞) in a compact manner in the unit disc. This is done by the means of single equation given by the Poincare disc model of hyperbolic geometry. Circuits exhibiting negative resistance have the magnitude of the voltage reflection coefficient bigger than unity and thus are mapped into the exterior of the classical Smith chart. In order to overcome the visual problems generated by this issue, two solutions were previously successfully proposed: the 3D Smith chart which implies the usage of sphere and the negative Smith chart, however both having their inconveniences; the 3D Smith chart, because it cannot be completely exploited without the means of a software tool while the negative Smith chart because it cannot be used at the same time as the regular Smith chart the scales used for one are meaningless for the other.
Hyperbolic Smith Chart Construction
The infinite generalized 2D Smith chart is regarded in the 3D Euclidean plane as lying on a plane and is mapped onto the superior part of two sheet hyperboloid using an immersion (vertical pull) onto the infinite surface of the hyperboloid. Then a stereographic projection form the point (0, 0, -1) from the two sheet hyperboloid onto the unit disc (used in the Poincare unit disc model of hyperbolic geometry), is then used to compact the entire surface of the superior part of the two sheet hyperboloid onto the unit disc.
A sequence of vertical pulling/stereographical projection, as shown in Figure 1, is applied (inspired by Beltrami-Klein model of non Euclidean geometry while using Poincare hyperboloid model).
The hyperbolic Smith chart maps the circuits with positive reactance above the horizontal (real line) of the ρh plane and the circuits with negative reactance below the real line of the hyperbolic reflection coefficients plane – as in the Smith chart. The constant reflection coefficients circles (0<|ρ|<1) of the classical Smith chart are completely mapped into circles with 0<|ρh|<0.414 (in the hyperbolic reflection coefficients plane while the (1<|ρ|<∞) constant circles (which are outside of the classical Smith chart- South hemisphere on the 3D Smith chart) are mapped all together in the unit disc of the hyperbolic reflection coefficients plane with 0.414<|ρh|<1.
Application Example
To obtain an oscillator at a specified frequency, the microwave active circuit must be designed to provide an infinite reflection coefficient at such a frequency. This requires moving to infinity in the reflection plane, thus a planar Smith chart not very useful (see Figure 2). In the hyperbolic reflection plane, infinity is represented by the unit circle (the way in which this approached proving an inductive or capacitive behavior). One may think in the hyperbolic reflections plane that as a reflection coefficient one moves towards the unit circle, its energy becomes lower and thus its movements become slower thus reaching it becomes impossible since it means infinity. The hyperbolic Smith chart allows solving this type of problem in the plane graphically using a unique visual representation (as shown in Figure 3), since the infinite mismatch point is placed in a bounded and finite position on the unit circle.
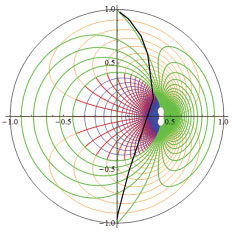
Figure 3 Input impedance (in black) of a microwave oscillator based on an Infineon bipolar transistor is tending towards infinity (unit circle) |ρ|= ∞ ↔ |ρh| = 1 on the hyperbolic Smith chart.
To the best of our knowledge, the first complete generalized hyperbolic Smith chart in the unit disc of the complex plane by mapping the entire reflection coefficients plane 0<|ρ|<∞into the unit disc of the hyperbolic reflection coefficients plane has been developed here. Circuits with negative resistance or with the magnitude of reflection coefficient |ρ|>1 which occur in oscillator, amplifier and other designs can be successfully plotted together with other circuits which can be visualized on the Smith chart. The hyperbolic Smith chart is governed by a single equation and can be easily drawn on any CAD tool using the Poincare disc model. If the reflection coefficient is tending towards infinity |ρ|=∞, then it will tend towards the unit circle of the hyperbolic Smith chart. The Smith chart mapped all the circuits with positive resistance in the unit circle of the reflection coefficients plane, while the hyperbolic Smith chart maps all circuits (exhibiting positive and negative resistance) in the unit hyperbolic reflection coefficients plane.
Acknowledgment
The authors wish to thank the Marie Curie CIG Siwtune 322162 and Dirección General de Ciencia y Tecnología MTM 2015-64013-P grants for their support.