Port tuning is a powerful technique for achieving first-pass design success. It enables the rapid tuning of complex filter structures with nearly full electromagnetic (EM) analysis accuracy.
After graduating from college in 1978, I designed a set of filters for the Landsat IV GPS preamplifier. Three of the filters were fabricated on alumina substrates. My mentor, Dr. Herbert Thal, one of the world’s leading filter designers, had developed some advanced (at the time) filter synthesis and tuning software,1 allowing the realization of filters that came fairly close to meeting very stringent design requirements – but not quite. In order to obtain design closure, we determined (using our tuning software) how much each resonator length and coupling distance needed to be changed in order to get closer to the required bandwidth, center frequency and group delay dispersion specifications. After re-fabricating each filter and finding we were closer, we repeated the process about three times before we were done.
Later, at Syracuse University, I studied numerical electromagnetics under another world-leading expert, Professor Roger Harrington, the father of the Method of Moments.2 For the record, Professor Harrington adopted the name “Method of Moments” from some similar work that had already been done in Russia. Many of the techniques that are special cases within the framework of the Method of Moments (e.g., the Galerkin technique and the Rayleigh-Ritz variational technique) had already been developed. It is Harrington’s work that provided the over-arching theoretical framework for this branch of numerical electromagnetics and allowed researchers and engineers everywhere to begin using it. This is not unlike Maxwell’s work with what we call Maxwell’s Equations.
After completing my Ph.D., I started commercializing the numerical EM technique I had developed under Professor Harrington.3,4 Applying this to filters, instead of repeatedly building filters, we repeatedly analyzed them. EM analysis is much, much faster than building each filter iteration, but it still takes time. Because popular filter designs were becoming more complicated and compact,5 the old synthesis techniques did not work as well. The number of filter fabrications was significantly reduced through EM analysis, but the required number of EM analyses were getting out of hand.
Dan Swanson developed a technique using Sonnet® where he could EM analyze a filter and include some extra ports on the ends of open-ended stubs used to couple between resonators.6 For some kinds of filters, this is where capacitive tuning screws are occasionally placed. The tuning screws are used to adjust the resonant frequency of each resonator and tune the filter so that it meets all requirements. Sometimes a bit of luck is required, because coupling between the resonators cannot be tuned this way.
Swanson inserted EM ports in the analysis in place of tuning screws. There was one extra EM port for the open end of each stub. Thus, if there were four open ends, there were six ports in the EM analysis. The extra two ports were for input and output. He would then take the EM analysis results and include them in a circuit theory analysis program such as Keysight’s
Advanced Design System (ADS) or NI AWR’s Microwave Office® (MWO). In the circuit theory schematic, he terminated the extra EM ports on the open ends of the stubs with an EM analyzed, open-end discontinuity and a short length of circuit theory transmission line. By tuning the short length of transmission line, he could tune the filter to meet its requirements at circuit theory speed, while almost the entire filter had been analyzed, to full EM analysis accuracy. The filter geometry6 actually has pairs of open ends, so he used EM-analyzed, coupled, open-end pairs and short lengths of coupled transmission line.
This approach provides circuit theory speed for tuning and optimization and nearly full EM accuracy. The technique still requires some effort by the designer, however, who must determine where to add the tuning ports and draw the schematic that connects the small circuit theory tuning elements. Then it is necessary to determine new dimensions for the filter based on the values of the tuning elements.
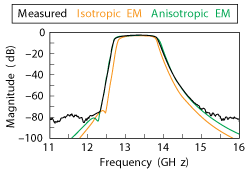
Figure 1 The first Sonnet anisotropic EM analysis.7
Once mastered, its power is significant. For example, when given a filter requirement, one early adopter had a design ready for fabrication the next day. If the specification is similar to a filter already designed, the layout may be ready for fabrication within the hour. Built on multi-layered ceramic, first pass success is assured.
This requires a little more than just the port tuning methodology and EM analysis. For example, ceramics are notorious for being anisotropic, i.e., the dielectric constant depends on direction. An electric field that is perpendicular to the substrate surface experiences one dielectric constant, and an electric field that is parallel to the substrate surface experiences a different one. If EM analysis predicts the correct center frequency, but the wrong bandwidth, it might be due to incorrectly assuming the substrate is isotropic.
FILTER EVALUATION
Figure 1 shows Sonnet’s anisotropy capability in the design of a filter, where measured data is compared with the results of Sonnet EM analyses. This illustrates that the calculated bandwidth is different from the actual bandwidth by not including anisotropy, which is corrected when anisotropy is properly accounted for. The isotropic substrate dielectric constant in the simulation is first adjusted to align the EM analysis center frequency with the measurement. Precise measurements of the anisotropic dielectric constants are then used in the Sonnet simulation, which results in the measured and calculated results lying on top of each other. It is important to emphasize that the anisotropic dielectric constants used in the simulation are precisely those that are measured; neither the dielectric constants nor the EM analyzed filter dimensions are altered to achieve these results.
The fact that nearly all ceramics and ceramic loaded substrate materials are strongly anisotropic may be surprising to some designers. This is because ceramic grains are generally not spherical. During manufacturing, they tend to orient themselves in the same direction as adjacent grains. In some cases, they tend to lie horizontally, especially near the surface. In other cases, they tend to stand vertically. It depends on the manufacturing process. Composite substrates (e.g., epoxy and fiberglass) are also strongly anisotropic. In addition to the anisotropy issue, composite substrates usually have a “butter” layer of epoxy on the top and bottom. For accuracy, these layers should be characterized and modeled as well. Sonnet can analyze anisotropy. Measurement of anisotropy is a matter of building and measuring a few resonators.7
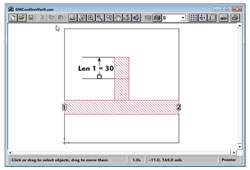
Figure 2 Microstrip open stub to be tuned to resonance at 25 GHz, demonstrating minimal EM analysis time.
Another factor for some substrate materials is metal roughness. Mechanical engineers intentionally increase the roughness on the substrate side of the metal foil in order to improve adhesion. Unfortunately, this also increases loss. The roughness also increases surface inductance, which is not widely known.8,9 This shifts the filter passband lower in frequency, an effect that is particularly pronounced in very thin substrates. Inexperienced designers may compensate by incorrectly increasing the substrate dielectric constant. This, correspondingly, increases bandwidth errors in the EM analysis.
Some designers may simply design for a wider or narrower bandwidth and hope that the actual bandwidth of the fabricated filter is on target. This may work for a while, but at some point, the designer will have a need for a new type of filter or a requirement to work over a different frequency range. Then the old rules-of-thumb may no longer suffice.
Sonnet includes models for metal roughness, both increased loss and increased surface inductance, and uniaxial dielectric anisotropy. Including all of these effects is necessary for accurate filter analysis as well as successfully using port tuning for rapid filter design.
Dan Swanson accomplished port tuning by adding EM ports to the ends of the resonators and then adding short lengths of circuit theory transmission line using a circuit theory program. Since his pioneering work, the flexibility and power of the port tuning technique has grown extensively.10 It has been the subject of considerable research11,12 and included in filter synthesis software.13
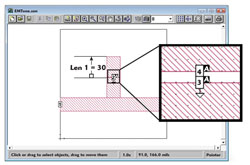
Figure 3 Open stub filter modified by cutting a narrow gap along the length.
MICROSTRIP OPEN-CIRCUIT STUB EVALUATION
Although complex filters can be tuned quickly using this same technique, the approach is best demonstrated with a very simple example, a microstrip open-circuit stub to be tuned to resonance at 25 GHz (see Figure 2). While it may initially seem strange, the first step is to destroy the filter by cutting a very short section out of the stub (see Figure 3). Internal ports are then added on each edge of the gap. These ports are used, through analysis, to “repair the damage” by connecting a short length of circuit theory transmission line across the gap. The initial transmission line length is exactly the same as that removed from the EM analysis.
The quality of these internal ports is critical to the success of port tuning. While the technique can work with nearly any kind of internal port when there is no alternative, errors introduced by uncalibrated or poorly calibrated ports can result in wasteful iterations and incorrect results. Provided the port connecting lines are not over-moded (e.g., they are not radiating), Sonnet’s internal ports are calibrated exactly.14, 15 In addition, these “Co-calibrated™” ports are calibrated in groups with all self and mutual fringing fields between the ports completely removed. A group of ports must all reside on the perimeter of a rectangle. Multiple groups are fine as long as individual groups are separated by more than the port-generated fringing fields.
Accurate and precise calibration is realized because Sonnet analyzes a circuit using an exact Green’s function inside a perfectly conducting box.4,16 The calibration uses the perfectly conducting sidewalls of the containing/shielding box to provide a perfect ground reference for all ports and a perfect short circuit calibration standard. Neither is possible in an unshielded (i.e., no box) approximate Green’s function based EM analysis. Thus, when a short section of the stub from the Sonnet EM analysis is removed and replaced with an equivalent length of circuit theory transmission line, the final result is exactly the same – a result which is easily verified. Descriptions of co-calibrated ports are provided by Crupi, et al.,15 and Rautio.17 They also provide illustrations of port tuning.
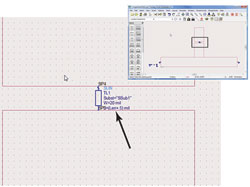
Figure 4 The open stub filter layout look-alike schematic element generated by Sonnet and automatically loaded back into ADS.
Performing a filter analysis inside a box is important. When used in a system of any kind, most filters must be placed in a conductive box for shielding. The box can strongly influence the in-band filter response,18 especially at high frequencies where high isolation is often required. For proper design, a filter must be EM analyzed inside the exact box in which it is expected to operate. In contrast, many published filter designs are not contained within a box when built or analyzed, indicating that such filters are never meant for actual application, but are for publication only. An unshielded filter also becomes an excellent antenna at high frequencies. This may be caused by highly over-moded resonators and electrically thick substrates. Rejection looks good when the filter is measured or analyzed in total isolation; however, the unwary designer may be surprised when the filter couples to everything around it.
DESIGN EXAMPLE USING SONNET AND ADS
Sonnet has extensive interoperability with ADS and MWO. Thus, port tuning using Sonnet for the EM analysis and either ADS or MWO for circuit theory tuning is straightforward. For those working on Si RFICs, Sonnet’s interface with Cadence Virtuoso allows the same easy design flow. Figure 4 shows the Sonnet result in ADS. In this case, the circuit layout was defined completely inside ADS, sent to Sonnet from ADS by means of an ADS menu selection, and the result automatically loaded back into ADS. Notice that the Sonnet result is shown in the ADS schematic with a convenient layout look-alike schematic symbol, automatically created in Sonnet for use in ADS. Port tuning can result in a large number of ports, so having a layout look-alike schematic component is exceptionally useful.
A short length of ADS circuit theory transmission line has been inserted between Ports 3 and 4 to “repair the damage” done by cutting the 0.5 mil gap in the stub. The length of the ADS circuit theory transmission line is set with a parameter, Len. The initial resonant frequency of the stub is 27 GHz. By optimizing Len in ADS, the resonant frequency of the stub is tuned to exactly 25 GHz in real time with circuit theory speed (see Figure 5). Len is equal to 3.8 mils, meaning that the length of the stub must increase by 3.8 mils. A confirming EM analysis of the stub with the new length and with the co-calibrated ports removed shows exactly the same result. Len may also be negative if it turns out that a shorter total length is needed for the final design.
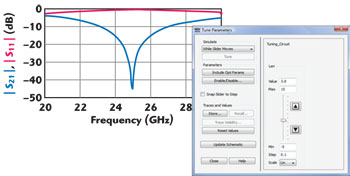
Figure 5 With port tuning, the resonant frequency of the stub is optimized in real time with circuit theory speed.
The complete circuit is analyzed to nearly full EM accuracy since the circuit theory part of the analysis is very small, the co-calibrated ports are perfectly calibrated (assuming the port connecting lines are not over-moded or radiating) and the EM analysis uses an exact Green’s function. The best of both worlds is achieved: tuning at circuit theory speed with nearly full EM accuracy!
CONCLUSION
Port tuning can be used to optimize more than just the length of an open-circuited stub. It can be used to optimize transmission line width and the gaps between transmission lines in more complex filter structures. This technique does require some up-front work by the designer; however, those who avoid it by insisting on having just one button to push will soon wonder why everyone else is producing filter designs so much faster and with more accuracy. The answer is “port tuning.”
Full port tuning tutorials using Sonnet with both ADS and MWO are available.19,20
References
- H.L. Thal Jr., “Computer-Aided Filter Alignment and Diagnosis,” IEEE Transactions on Microwave Theory and Techniques, Vol. 26, No. 12, December 1978, pp. 958–963.
- R.F. Harrington, “Field Computation by Moment Methods,” Macmillan, New York, 1968, Reprinted Wiley-IEEE Press, 1993.
- J.C. Rautio, “A Time-Harmonic Electromagnetic Analysis of Shielded Microstrip Circuits,” Ph.D. Dissertation, Syracuse University, Syracuse, N.Y., 1986.
- J.C. Rautio and R.F. Harrington, “An Electromagnetic Time-Harmonic Analysis of Shielded Microstrip Circuits,” IEEE Transactions on Microwave Theory and Techniques, Vol. 35, No. 8, August 1987, pp. 726–730.
- J.S. Hong and M.J. Lancaster, “Microstrip Filters for RF/Microwave Applications,” Wiley, N.Y., 2001.
- D.G. Swanson, Jr. and W.J. R. Hoefer, “Microwave Circuit Modeling Using Electromagnetic Field Simulation,” Artech House, Norwood, Mass., 2003.
- J.C. Rautio, R.L. Carlson, B.J. Rautio and S. Arvas, “Shielded Dual-Mode Microstrip Resonator Measurement of Uniaxial Anisotropy,” IEEE Transactions on Microwave Theory and Techniques, Vol. 59, No. 3, March 2011, pp. 748–754.
- A.F. Horn III, J.W. Reynolds, P.A. LaFrance and J.C. Rautio, “Effect of Conductor Profile on the Insertion Loss, Phase Constant, and Dispersion in Thin High Frequency Transmission Lines,” DesignCon 2010, February 2010.
- A.F. Horn III, J.W. Reynolds and J.C. Rautio, “Conductor Profile Effects on the Propagation Constant of Microstrip Transmission Lines,” IEEE MTT-S International Microwave Symposium Digest, May 2010.
- D.G. Swanson, “Narrow-Band Microwave Filter Design,” IEEE Microwave Magazine, Vol. 8, No. 6, October 2007, pp. 105–114.
- Q.S. Cheng, J.W. Bandler and S. Koziel, “Space Mapping Design Framework Exploiting Tuning Elements,” IEEE Transactions on Microwave Theory and Techniques, Vol. 58, No. 1, January 2010, pp. 136–144.
- Q. S. Cheng, J. C. Rautio, J. W. Bandler and S. Koziel, “Progress in Simulator-Based Tuning—the Art of Tuning Space Mapping,” IEEE Microwave Magazine, Vol. 11, No. 4, June 2010, pp. 96–110.
- “The Best in Filter Design Software,” Nuhertz, 15 October 2014. www.Nuhertz.com.
- J. C. Rautio, “De-embedding the Effect of a Local Ground Plane in Electromagnetic Analysis,” IEEE Transactions on Microwave Theory and Techniques, Vol. 53, No. 2, February 2005, pp. 770–776.
- G. Crupi and D. Schreurs, “Microwave De-Embedding – From Theory to Applications,” Elsevier, 2014, Chapter 4, pp. 151–187.
- B.J. Rautio, V.I. Okhmatovski, A.C. Cangellaris, J.C. Rautio and J.K. Lee, “The Unified-FFT Algorithm for Fast Electromagnetic Analysis of Planar Integrated Circuits Printed on Layered Media Inside a Rectangular Enclosure,” IEEE Transactions on Microwave Theory and Techniques, Vol. 62, No. 5, May 2014, pp. 1112–1121.
- J.C. Rautio, “Perfectly Calibrated Internal Ports in EM Analysis of Planar Circuits,” IEEE MTT-S International Microwave Symposium Digest, June 2008, pp. 1373–1376.
- G.L. Matthaei, J.C. Rautio and B.A. Willemsen, “Concerning the Influence of Housing Dimensions on the Response and Design of Microstrip Filters with Parallel-Line Couplings,” IEEE Transactions on Microwave Theory and Techniques, Vol. 48, No. 8, August 2000, pp. 1361–1368.
- “Sonnet IMS Tutorials,” Sonnet High Frequency Electromagnetic Software, Sonnet Software. 15 October 2014. https://www.sonnetsoftware.com/resources/videos/IMStutorials.htm.
- “ADS Port Tuning Tutorial” and “MWO Port Tuning Tutorial,” Features section of Sonnet Software website at www.sonnetsoftware.com/resources/index.asp.
