
Mobile data communication utilization is increasing rapidly, outpacing voice communication utilization due to the increasing number of mobile data consumers. New radio access networks (RAN) are currently being developed and tested to accommodate this growth in data capacity and mobile data users. For instance, long term evolution (LTE) RANs are now being tested and deployed globally. This raises the corresponding demands on radio transceiver performance, such as a lower noise figure (NF), a high input intercept point of second/third order (IIP2/IIP3) and operation over a wider bandwidth (BW). Better immunity against large unwanted signals is also desired.
Yet a cellular base transceiver system (BTS) can be deployed in such a way that the total number of BTSs in a given region can be reduced, while still maintaining optimal cell coverage. From an operator perspective, this yields opportunities to reduce CAPEX and OPEX.
A low NF is not the only RF parameter that matters for an LNA. The number of interference signals increases when the number of users in one cell is increased. To cope with high levels of interfering signal levels, the linearity of the LNA needs to be increased while maintaining the lowest possible NF. Finally, the NF and linearity should be flat over frequency to support wideband RANs.
NF Link to Cell Distance
In order to link the LNA’s NF to cell distance, some intermediate steps have to be made first. Two classical formulas are used, one for the receiver sensitivity and the other for the propagation model. The receiver sensitivity Psens is expressed as:
where k is Boltzmann’s constant, T is the device temperature, B is the signal bandwidth (in case of UMTS 3.84 MHz), Fsys is the system noise factor, PG is the processing gain (in case of WCDMA), and Eb/No is the bit energy to noise energy ratio.
The radio link budget assumes a minimum signal level to be received at the cell edge, usually expressed in terms of a maximum allowable path loss together with a link margin to provide a specified level of Quality of Service (QoS). A statistical analysis of the radio signal measurements exposes that the path loss (PL) at any particular location between the base station and mobile stations at any distance (d) can be expressed as a random variable, which follows a log normal distribution around the median path loss value. The propagation model that is used here is the COST Okumura-Hata model:
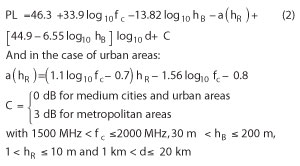
where PL is the median path loss (dB), fc is the radio frequency (MHz), hB is the base station antenna effective height (m), d is the link distance (km), hR is the mobile station antenna effective height (m) and a(hR) corresponds to the mobile station antenna height correction factor (dB). In suburban areas, 8 dB standard deviation is subtracted to deal with shadowing. The total medium path loss (PL) is obtained from the total link budget as shown in Appendix 1 (view online at mwjournal.com/NXPappendix).
In addition, other parameters have to be included in the link budget. These are:
Soft hand over (SHO) gain, which is gain against slow fading (log normal fading) by reducing log normal fading margin. Soft hand over is the ability to exploit the macro diversity between different Node Bs. All cellular systems use multi-antenna diversity at the base station receiver and transmit antenna diversity at the base station transmitter. However, these ‘micro diversity’ techniques are mainly aimed at mitigating the effects of multipath fading and have very little impact on the larger scale like shadow fading.
If a mobile device can establish simultaneous links to different Node Bs, then, given the spatial separation of the Node Bs, each link is likely to experience a different shadow fading characteristic. By combining the information received on each individual link, the effects of shadow fading can be mitigated to some degree and this is termed macro diversity.
Uplink noise rise: There is a trade off between intended uplink coverage and uplink total received interference power. The total received power increases due to the addition of a user in the cell and depends heavily on the uplink noise rise (NR). This is defined as the ratio of total received interference power to background noise power, NR = C/N. It represents the direct relationship between total interference power increase and current noise increase, as opposed to current total received interference power. This is the reason why uplink noise has to be included in the link budget. Noise rise is also often described by means of the cell load η: 10 Log (1/(1 - η)). In this article, a cell load of 0.7 (or 5.23 dB) is used.
Log-normal fade margin: Slow fading is caused by events such as shadowing, where a large or tall obstruction such as a hill or a tall building obscures the main signal path between the transmitter and the receiver. The amplitude change caused by shadowing is often modelled using a log-normal distribution with a standard deviation according to the log-distance path loss model. In this example, a standard deviation of 5 dB is used with a confidence probability of 90 percent.
Voice communication is the most critical consideration in cell planning, due to the fact that no retransmission is allowed compared to data transmission. For this reason, the link budget is based on voice communication. The lowest voice data rate using adaptive multi-rate audio speech (AMR) codec is 12.2 kbps. In UMTS, the chip rate is 3.84 MChips/s, which results in a spreading gain or processing gain of 25 dB.
The total base station transmission power is chosen to be 40 dBm or 10 W into 50 Ω, measured at the output of the final stage amplifier. The output power level is attenuated by cable and connector losses before it arrives at the antenna connector. The 40 dBm power is conducted power and needs to be converted to radiated power or effective isotropic radiated power (EIRP). An isotropic radiator radiates power equally in all directions. However, a perfect isotropic radiator is only theoretical. All realizable antennas will concentrate the power in a certain direction. For instance, a half wave dipole has an antenna gain of 2.15 dBi. In this article, the antenna gain of the base station is assumed to be 18 dBi, which gives a total EIRP of 55.5 dBm or 355 W radiated power.
The radiated power is further attenuated by free space loss and absorption by materials like trees, concrete buildings, etc. Moreover, not only attenuation takes place but also reflection, refraction and diffraction. For diffraction, an additional margin, called fading margin, should be included in the link budget and here a 5.1 dB lognormal fading margin is assumed.
At the UE side, the antenna receives the multiple replicas of the wanted and unwanted signals. The radiated power received at the antenna is converted into conducted power where an antenna gain of 0 dBi is assumed. In addition, an extra body loss of 3 dB should be accounted for in the link budget. This reflects the fact that antenna gain is measured in free space, whereas in practice the handheld device is close to the human head, which reduces the antenna gain.
Via the duplex filter, the received signal enters the input of the LNA, after which it will be further processed toward the base band. This concludes the downlink Node B (transmit) to UE (receive). In fact, the return path UE to node B is of greater importance for a base station.
In the uplink from transmitting UE to receiving Node B, the maximum transmit power at the UE is limited, due to battery operation lifetime. Here, a conducted power of 21 dBm or 126 mW into a 50 V termination is assumed. Likewise for the downlink, the antenna gain is set to 0 dBi and a body loss of 3 dB is assumed. The conducted power is converted to EIRP at the UE antenna and equals 21 dBm. It is assumed that the radio channel is equal for the downlink and the uplink.
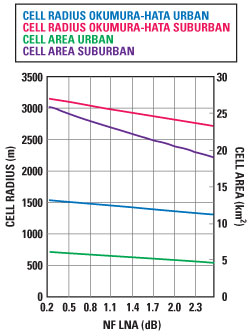
Figure 1 Cell radius and cell area as a function of LNA NF.
At Node B, the receive antenna gain is again 18 dBi. Additional losses (antenna connector, cable and duplex filter) should be subtracted from the received conducted power. For the sake of simplicity, diversity gain is not used in this link budget calculation. After the receive antenna, connector and cable losses, the received signal arrives at the input of the duplex filter. This filter has an insertion loss of 0.6 dB. To meet the receiver sensitivity level, the total front end noise figure should not exceed 3.1 dB.
This 3.1 dB can be decomposed into several contributions, duplex filter losses (0.6 dB), baseband processing noise (0.5 dB) and front end noise. The front end noise includes ADC noise and, given the duplex filter noise and baseband noise, the overall front end noise figure (NF) is 1.9 dB, assuming that the LNA contributes most of it and is chosen to be 0.6 dB. Knowing the total system noise figure NFsys, the receiver sensitivity can then be calculated. Given the thermal noise density and the total system noise, the total noise density can be calculated as −170.7 dBm/Hz. Next the minimum signal strength, or sensitivity level, for a given bit error rate can be calculated.
This level is defined by the required Eb/No, the bit energy divided by the noise energy, which is often provided in the standard and depends heavily on the radio channel propagation conditions. In this article, using a voice call at 12.2 kbps and a pedestrian channel the Eb/No is specified as 11.9 dB. Adding the total noise density, the required Eb/No and processing gain and converting from power density to power level by adding the bandwidth logarithmically, the receiver sensitivity is obtained (–112 dBm). Finally, after inclusion of all of the aforementioned effects, the total path loss (PL) [dB] can be calculated as:
PL = EIRP Tx power + Rx antenna gain - body loss - noise rise + Rx diversity gain - cable/connector loss - receiver sensitivity + SHO gain (dB).
Knowing the total path loss (= median path loss) from the link budget and the path loss channel model from Okumura-Hata path loss model for urban and suburban areas, the cell radius can then be calculated. In the case of the pedestrian channel, the cell radius is assumed to be 1.3 km for urban areas and 2.6 km for suburban areas. Suppose that the shape of a cell is a regular hexagon with a cell radius of 1.3 km or 2.6 km, then in the case of an urban area the covered area is 4.4 km2 and 17.6 km2, respectively. If the NF of the LNA is swept from 0.2 to 2 dB, the cell radius gain and cell area gain can be plotted as shown in Figure 1. Reducing the NF of the LNA by a factor of 2 increases the cell area by more than 7 percent. Therefore, the usage of an LNA with an NF of 0.4 dB instead of having an NF of 2.0 dB increases the operator’s coverage by 26.5 percent. Figure 2 illustrates the cell coverage improvement achieved by lowering the LNA’s NF.
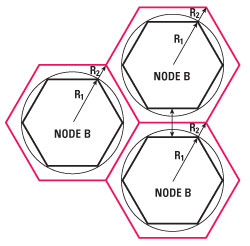
Figure 2 Cell coverage increase by lowering LNA NF.
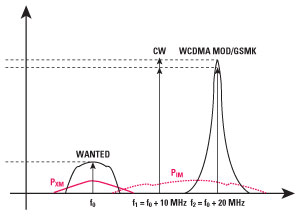
Figure 3 Intermodulation requirement for WCDMA wide area base station.
Cross and Intermodulation Characteristics
There are two basic nonlinear distortion mechanisms, one is the intermodulation and the other is the cross-modulation. Intermodulation may produce an additional amount of noise in the wanted frequency channel, called PIM, (see Figure 3). The cross-modulation characteristics are a measure of the immunity of the base station receiver against interferers that produce a spurious response within the wanted assigned channel frequency. This specification sets the cascaded input referred third-order intercept point (IIP3) of the base station receiver. Cross-modulation distortion is the most significant distortion mechanism in WCDMA receivers, where the modulated transmitter signal in the receiver path cross-modulates with a close-in jammer to produce in-band distortion.
Normally the static reference performance of the wanted signal is defined 3 dB above the reference sensitivity level. Two interfering signals with specific cross-modulation performance requirements are added. Figure 3 shows the intermodulation and cross-modulation requirements in the case of a WCDMA wide area base station non-narrow band cross-modulation. The red line (PXM) represents the result of cross-modulation from the CW tone with the WCDMA modulated signal and falls in the wanted frequency.
In order to calculate inter-modulation requirements, two more parameters are needed: the required Eb/No to meet the reference BER and the maximum allowed receiver desensitization X. The reference BER for voice speech is Eb/No = 8.3 dB and the power levels of the two interferer signals are for Pcw = −48 dBm and for the Pwcdma = −48 dBm/3.84 MHz. Accordingly, the IIP3 can be calculated using the equation:
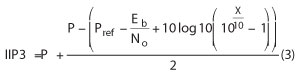
where P = Pcw = Pwcdma are the interference power levels, Pref is the reference sensitivity level, Eb/No is the level to meet the reference BER and X is the receiver desensitization factor. Where X is set to 3 dB, the cross-modulation noise (PXM) is equal to the thermal noise floor (No) and the receiver is desensitized by 3 dB, thus Pref is increased from −115 dBm to −112 dBm. In the 3GPP standard, a 3 dB receiver desensitization is specified.
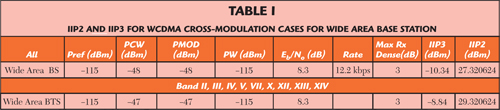
However, since there are more distortion components that will desensitize, the receiver base station manufacturers apply a lower value. Here, a receiver desensitization of X = 3 dB is taken, due to intermodulation specifications according to the 3GPP standard. Table 1 shows the IIP2 and IIP3 numbers for WCDMA wide area base station.
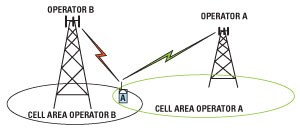
Figure 4 Graphical blocking description in case of two operators working in the same area.
Blocking Characteristics
The blocking characteristics are a measure of the receiver’s ability to receive a wanted signal at its assigned frequency channel in the presence of an unwanted interferer on frequencies other than those of the adjacent channels. Distinction is made between adjacent channel blocker, in-band blockers (IBB) and out-of-band blockers (OOB). This can better be explained by referring to Figure 4. When node B from operator B is receiving a strong (IBB) signal from a mobile device linked to operator A, but working in operator B adjacent carrier, then node B from operator B can be blocked. Operators have to deal with this so-called near-far problem. The signal strength of the blocking signal depends on many aspects such as cell size and position. A worst case situation will occur when the sites of operator B are allocated at the cell borders of operator A.
Adjacent Channel blocker
In the test specification of the 3GPP standard, the adjacent channel selectivity (ACS) is a measure of the receiver’s ability to receive a wanted signal at its assigned channel frequency in the presence of an adjacent channel signal at a given frequency offset from the center frequency of the assigned (wanted) channel. ACS is the ratio of the receiver filter attenuation on the assigned channel frequency to the receiver filter attenuation on the adjacent channel(s). The adjacent channel blocker can be linked to adjacent channel leakage ratio (ACLR) by the following empirical formula:
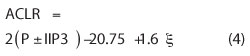
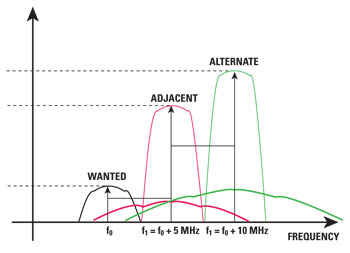
Figure 5 Blocking WCDMA characteristics (adjacent and alternate channels).
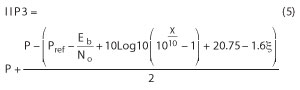
where P is the blocking power, IIP3 is the input inter-modulation of third order, the 20.75 is a constant that depends on CCDF statistics of the WCDMA signal, and j is the peak to average ratio (PAPR). Note that this formula is only valid in cases where an adjacent channel has only a single carrier. ACLR itself can be written as PIM3-P (note that ACLR results in a negative dBc number). Including the receiver desensization factor X, the IIP3 can be expressed as:
The PAPR factor j is set to 11 dB (worst case). For a wide area base station, the interfering signal mean power level P is −52 dBm at a frequency offset of 5 MHz (the adjacent channel). The reference sensitivity level mean power is −115 dBm (for voice rate of 12.2 kbps). Figure 5 shows the blocking characteristics for WCDMA.
Substituting the values in Equation 5 gives the IIP3 due to adjacent channel blocking as −6.61 dBm.
In-band Blockers
In-band blocking characteristics are a measure of the receiver’s ability to receive a wanted signal at its assigned channel frequency in the presence of an unwanted interferer on frequencies other than those of the adjacent channels (alternate channel). This is shown in Figure 6 as F0+10 MHz – since these interferers are beyond 5 MHz, the ACLR requirement is not of interest. It is assumed that intermodulation is responsible for the distortion.
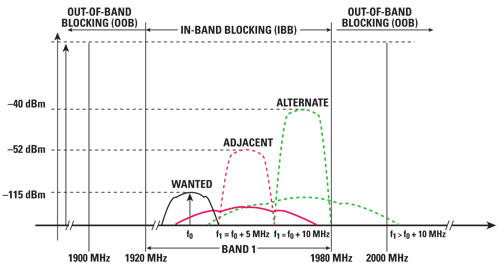
Figure 6 In-band adjacent and alternate channel WCDMA blockers.
The center frequency of the interfering signal (band I) is between 1920 and 1980 MHz. For a wide area base station, the interfering signal mean power is −40 dBm, where the static reference performance is met with −115 dBm wanted signal mean power. Equation 5 is not applicable for alternate channels, therefore Equation 3 will be used here. Substituting the power values and the receiver desensization factor X of 0.1 dB, the required IIP3 due to alternate channel blocking equals 9.81 dBm.
Out-of-Band Blockers
Referring to 3GPP band I blocking performance, there is also a requirement for out-of-band interference from 1900 to 1920 MHz and 1980 to 2000 MHz bands. These frequency ranges are just outside the wanted receive band from 1920 to 1980 MHz. Using wide area base station requirements, the interfering signal mean power is −40 dBm in this OOB case (1900 to 1920 MHz and 1980 to 2000 MHz). The static reference performance is met with −115 dBm wanted signal mean power. This results in the same IIP3 as in the IBB case 9.81 dBm since the types of blocking signals are the same.
Finally there is a requirement for
1 to 1900 MHz and 2000 to 12750 MHz, where the interferer is a CW having a power level of −15 dBm. The frequency offset is 20 MHz away from the Band I frequency edges. It is assumed that this part of OOB can be partly filtered. For instance, suppose that the interferer can be attenuated by 30 dB worst case (typical 40 dB attenuation). In this case the IIP3 equals 2.3 dBm when dominated by intermodulation.
More important is the Tx (2110 to 2170 MHz) leakage into the receive band (1920 to 1980 MHz). In the case of a FDD system, the Tx-Rx separation is 190 MHz and a commercial available duplex filter has 40 dB attenuation. Suppose that the average transmit power is 49 dBm/3.84 MHz (80 W/3.84 MHz in 50 V) then the Tx signal that leaks into the Rx band is 9 dBm/3.84 MHz. The requirement for a wide area base station that limits spurious emissions for protection of the base station receiver is -96 dBm measured in 100 kHz, or −80 dBm/3.84 MHz. Fortunately the Tx and Rx time slots have a certain delay so that during the Rx slot, the Tx leaked signal is sufficiently ramped down.
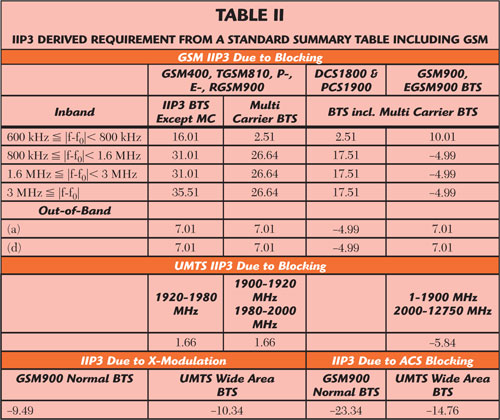
Table 2 shows the IIP3 derived requirement summary for GSM and WCDMA. It can be concluded that GSM sets the demanding IIP3 requirements. Note that these values are obtained from the values written in the GSM and WCDMA standard (3GPP). In the case of single carrier GSM, a sharp bandpass filter is required to attenuate the blocking signals, while for multicarrier GSM, a band pass filter is only applied where multiple carriers are passed through.
According to Table 2, using the blocking requirement from R-GSM MC BTS standard results in an IIP3 of 26.64 dBm and includes relaxation for multicarrier GSM. But the likelihood that a blocker has a level beyond the power level is limited. Today’s LNAs achieve an IIP3 between 17 and 19 dBm at a fixed gain of 18 dB.
Reducing Base Station Numbers
Besides the improvement in cell coverage due to low NF, there is an additional financial benefit for the operators. Take for example two LNAs with two different noise figures of 0.9 and 1.2 dB. Given the LNAs’ NFs, the cell size is known and the area of the country – in this case the Netherlands with an area of 41,526 km2. Assume also that there are more urban base stations than suburban base stations. In this calculation, the distribution is taken to be 70 percent, 30 percent.
The annual costs for one base station are as follows. Assume one base station consumes 800 W and the price for electricity is €0.20/kWh, then the price for one year is €1397.76. Further assumptions are O&M €3000 per unit and average site lease costs of €5000 per year.
Initial costs include equipment purchase and site build out, including installation, which are €40,000 and €80,000 per unit. Adding all costs together and working them out across the Netherlands gives a total cost savings of €34.3 million, which is significant. If divided among the number of operators, this represents substantial savings per operator. In terms of the number of base stations, the savings is 4.4 percent and CAPEX and OPEX is reduced by 4.5 percent.
Conclusion
This article has shown that the noise figures of LNAs can be linked to the distance of the cell coverage via link budget calculations. On the other hand, the number of interference signals increases when the number of users in one cell is increased. To cope with high levels of interfering signal levels, the linearity of the LNA needs to be increased while maintaining the lowest possible NF. More important for network operators, lowering the LNA NF yields savings in CAPEX and OPEX (4.5 percent).