
VNA EXTENDER MODULES
VNA extender modules are used to extend the VNA measurement capabilities to higher frequency bands. These modules typically contain components that use rectangular waveguide connectors for signal transmission. This means that each system operates only across a particular rectangular waveguide frequency band.
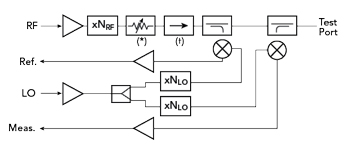
Figure 3 Functional block diagram of a typical VNA extender module.
A functional block diagram of a typical VNA extender module is shown in Figure 3. The test signal from the VNA is coupled to an amplifier-multiplier chain to increase the frequency to the desired band with an overall multiplication factor of NRF as shown in the diagram. This signal then passes through a series of components before being transmitted out the test port. These components often include a variable attenuator, an isolator and most importantly, a pair of directional couplers. The local oscillator signal, coming from a second synthesizer within the VNA, is also amplified and multiplied by a factor of NLO and then coupled to two down-conversion mixers through a splitter. The reference mixer, located in the “Ref.” path, receives a small portion of the outgoing signal. This signal is converted to a lower frequency that can be detected and analyzed by the receivers in the VNA. This path essentially defines the magnitude and phase of the outgoing wave for the VNA. The second mixer performs the same function for any signal that is coupled in through the test port. Examples of this are signal power reflected from the input match of the DUT back to the extender module or signal power from another extender module that has passed through the DUT. Using two identical modules, it is possible to measure all four S-parameters of a two-port DUT.
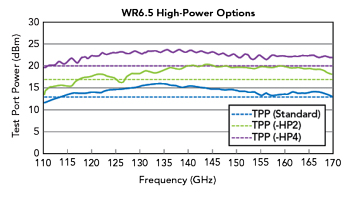
Figure 4 Measured test port power for three VDI WR6.5 extenders.
For measurements of passive components, the S-parameters do not depend on signal power. This means that only a modest signal power is required. However, for active load-pull, power levels commensurate with the maximum power available from the DUT are desired to enable measurements that cover greater regions of the Smith chart.
New high-power VNA extender modules have been developed with higher-power multipliers and amplifiers. However, other system components must also be modified to ensure appropriate function and reliability at these higher power levels. Also, the system must be modified so that the mixers cannot be saturated under the full range of expected operating conditions. Other aspects of the module design, including thermal considerations and the module size, must also be reconsidered. The increased test port power levels for a WR6.5 extender module are shown in Figure 4.
It is important to note that the measurements presented in this article used the standard and -HP2 high-power versions of the VDI extender modules. Additional power sweep saturation and load-pull contours could be achieved by using the -HP4 extender module.
GAIN COMPRESSION AND PAE POWER SWEEP MEASUREMENTS
Gain compression and power-added efficiency (PAE) power sweep measurements were performed on a four-finger InP HBT from the ETH Zurich Millimeter Wave Electronics Group. The measurements were performed at 140 GHz using both the standard and the -HP2 high-power extender modules. While the standard extender was able to drive the DUT into compression, it did not have sufficient power to meet the P1dB threshold or achieve maximum PAE. Switching to the high-power extender resulted in approximately 2.5 dB of additional transmit power, surpassing the P1dB threshold and allowing determination of the maximum PAE. Gain compression power sweep measurements are shown in Figure 5 and PAE power sweep measurements are shown in Figure 6. Each curve represents a gain compression power sweep measurement at a unique load impedance using the same impedance pattern that will be shown in the next section of this article.
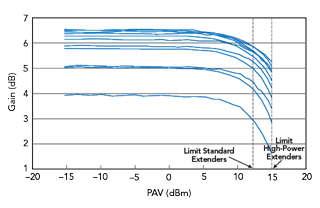
Figure 5 Gain compression power sweep measurements at 140 GHz.
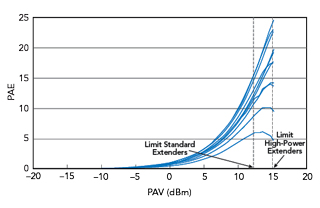
Figure 6 PAE power sweep measurements at 140 GHz.
ACTIVE LOAD-PULL MEASUREMENTS
Active load-pull measurements were performed on the same four-finger InP HBT at 140 GHz and 170 GHz using the standard and -HP2 high-power extender modules. As expected, the high-power extender modules were able to achieve a higher magnitude of reflection, ΓL, or Smith chart coverage as compared with the standard extender modules. The load-pull iso-contours for output power at 140 GHz are shown for the standard extender modules in Figure 7a and the iso-contours for output power using the high-power extender modules are shown in Figure 7b. The iso-contours for output power using the standard extender module results at 170 GHz are shown in Figure 8a. Figure 8b shows the iso-contours for output power using the high-power extender modules at 170 GHz.
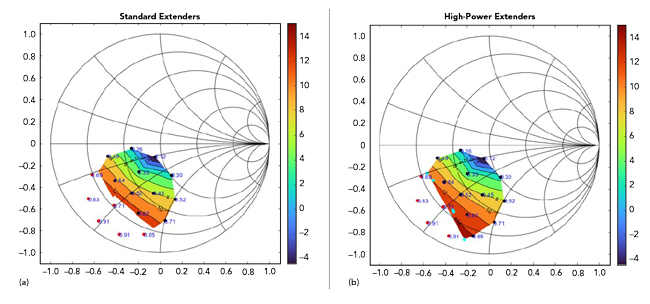
Figure 7 (a ) Load-pull iso-contours for output power using standard extender modules at 140 GHz. (b) Load-pull iso-contours for output power using -HP2 high-power extender modules at 140 GHz.
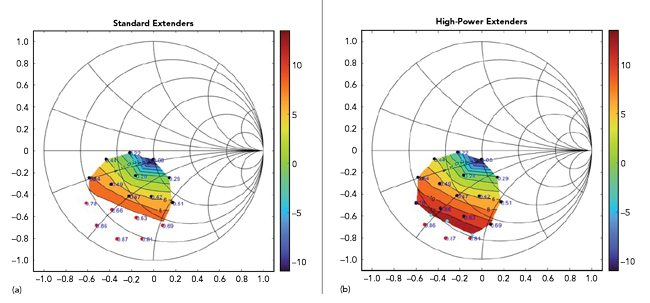
Figure 8 (a) Load-pull iso-contours for output power using standard extender modules at 170 GHz. (b) Load-pull iso-contours for output power using -HP2 high-power extender modules at 170 GHz.
CONCLUSION
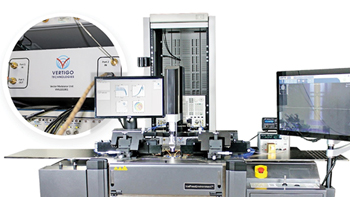
Figure 9 Active load-pull system with characterization software.
Active load-pull is an elegant and practical method of characterizing semiconductor technologies at mmWave and sub-THz frequencies. The maximum power available to drive the DUT into compression and to perform active tuning is often limited by the output power of the VNA extender module. However, high-power models using higher-order combining techniques enable the complete characterization of larger devices as well as allowing higher magnitudes of reflection and more Smith chart coverage for load-pull measurements up to 1.1 THz. Figure 9 shows an active load-pull setup that enables all the measurements and characterizations that have been discussed in this article. This setup will operate to 1.1 THz with the appropriate VNA extender modules.