
During pre-installation GBO testing, all potential waveforms and transmission periods were tested at full power with a termination and monitoring coupler in place of the feed to verify system robustness under typical use. Measurement of the 200 MHz waveform is shown in Figure 6.
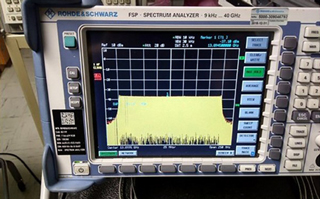
Figure 6 200 MHz waveform.
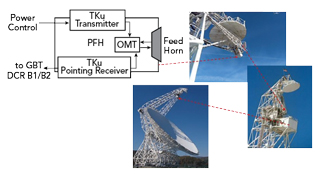
Figure 7 PFH block diagram and location on the GBT.
GBT TRANSMISSION TESTING AND CALIBRATION
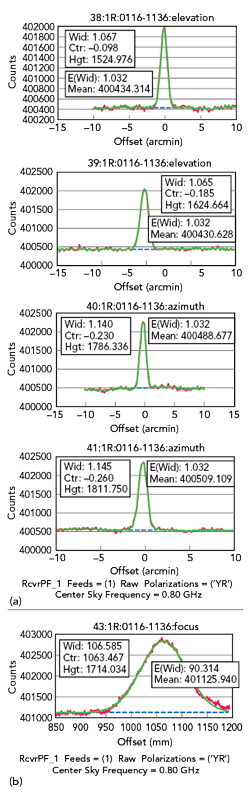
Figure 8 Peak (a) and focus (b) scans of the Ku-Band quasar calibrator 0116-1136 (1.151 Jy). GFM fits: baseline = dashed blue line; observation data = red; Gaussian fit = green.
Prior to the use of the GBT for transmitting, the GBT software pointing model for the PF was only accurate below 2 GHz. Without updating the software pointing model, the errors when used at 11 to 14 GHz at the PF could have been large enough for the transmitter beam to miss the target. By duplexing a pointing receiver with the transmitter using the same feed horn, on-the-fly updates of the GBT software pointing model were possible without the laborious, time-consuming and potential error-inducing exchanges of the transmitter with a receiver. A general diagram of the PFH and its location on the GBT is shown in Figure 7.
To enable observations with the transmitter, dedicated software changes of the GBT’s Manager and Control System were needed. These changes were two-fold: 1) to enable pointing and focusing of the PF receiver; and 2) to enable the 12 GHz during the observations. Implementation of software routines allowed, within ASTRID scripts (GBT Observing Guide, 2017), pointing the transmitter using the PF at 12 GHz (rest frequency center at 11.95 GHz) to peak and focus using the GBT FITS Monitor (GFM) software.
The GFM software fits a beam pattern to a cross-scan on a calibrator and calculates the pointing offset and correction for the observations. The routines were: 1) a new configuration of the transmitter pointing receiver at the PF, rest frequency at 11.95 GHz, connected to the Digital Continuum Receiver (DCR) back-end; 2) running the pointing model at the PF; 3) GFM peak and focus interactive correction using the transmitter pointing receiver at the PF. Prior to transmissions a “pointing run” was executed, where the GBT was pointed at a Ku-Band quasar of well-known location and intensity (ranging 1 to 20 Jansky), and the antenna was moved in azimuth, then elevation. The total power detected in the pointing receiver versus azimuth and elevation directions was measured at a fine scale and from these measurements the pointing model was updated. A focus scan was then executed on the source to calibrate the focus prior to tracking using the ephemeris of the selected target and begin transmission of observations.
Transmission testing consisted of a commissioning phase in which the transmitter went through a series of warm-up cycles through transmission of specific modes of operation including CW and LFM waveforms. The VLBA receiving stations were not involved during the commissioning phase. After the transmit session, tests were dedicated to checking the receiver for pointing and focus corrections/calibration repeatability using geo-stationary (GEO) satellite Ku-Band beacons, i.e. GALAXY18 (GEO Slot#123.0; NORAD#32951, Az 236.5, El 27.1), and radio-astronomical calibrators (Ku-Band quasar). The transmitter was not operating during the calibration session.
Pointing checks were run through a series of peak scans to test the receiver’s sensitivity. The artificial Ku-Band sources saturated the receiver’s high-sensitivity channel but were observable switching to the low sensitivity DCR channel B1, X polarization. The radio-astronomical calibrators were observable with the receiver’s high-sensitivity DCR channel B2, Y polarization. This configuration was used as default configuration for pointing, focus scans and tracking on targets for observations during transmission and data collection.
DATA COLLECTION
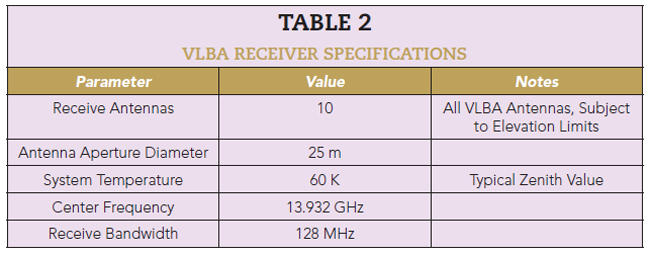
The observations and data collection were coordinated between the GBT and VLBA through planned observations blocks with detailed time sequence, transmit and receive parameters. Target range and elevation above the horizon with respect to transmit and receive sites was based on ephemerides derived from JPL’s Horizons system.3 The GBT operated the transmitter from an elevation between 10 and 80 degrees. The VLBA participated as a set of 10 single-dish receiving stations (see Table 2).
The VLBA’s back-end system and recorder were used to acquire the data. Baseband signals were recorded at a Nyquist rate for 16, 32, 128 and 256 MHz bandwidths in both circular polarizations. Data were stored in the VLBI Data Interchange Format with two bits per sample quantization. A portion of the data acquired at 16 and 32 MHz bandwidths was transferred in real time to computers at the VLBA operations center for rapid diagnostic evaluation. The complete set of recordings was later shipped on hard disk from each site. The wide geographic distribution of VLBA antennas meant that, at times, not all antennas were able to participate in the full duration of the observations.
The repeatability of performing blind pointing on preferred targets was satisfactory within a fraction of a beamwidth in azimuth and elevation depending on the sources (20 to 30 arcseconds). Focus offset was established at approximately 1050 mm (900 mm fix correction as per MRQ1R2 +150 mm adjustment), which was added as the default starting correction for the observations. These values were established during the radar run in November 2020 and confirmed in the second radar observation run in March 2021. For the Apollo 15 observation (March 13, 2021) peak and focus scans of the Ku-Band quasar calibrator 0116-1136 (1.151 Jy) are shown in Figure 8, nearby the moon, before tracking on the targeted moon location. Peak scans 38 through 41 on source 0116-1136 are shown in Figure 8a. Focus scan 43 on source 0116-1136 is shown in Figure 8b. During observations, the transmission waveforms and VLBA receive modes would vary depending on observation goals. A summary of used parameters is shown in Table 3.
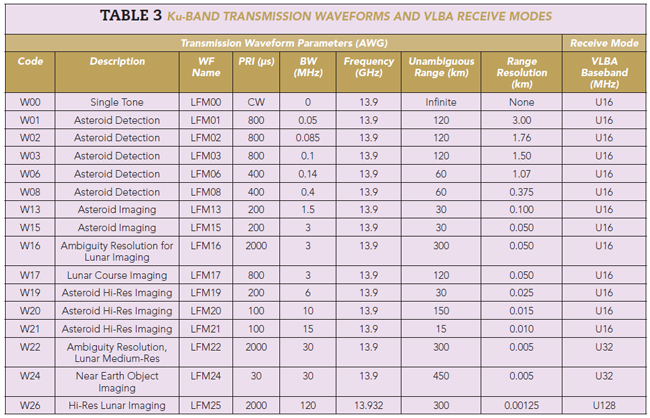
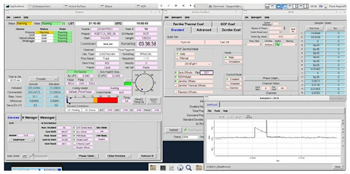
Figure 9 Control panel while tracking FO32.
The opportunity to observe asteroid 2001 FO32 (231937) at a close approach range of 0.01348 AU on March 21, 2021, was planned. The predicted angular difference between transmit and receive ephemeris using JPL’s Horizons was 52 arcsec. Therefore, given our 54 arcsec. beamwidth, this ephemeris error required leading the target (courtesy of John Giorgini, JPL) to maximize return SNR. A control panel snapshot during tracking of FO32 and waveform transition detected at the DCR (total power counts) is shown in Figure 9.
The GBT transmission experiments gave the NRAO and RI&S an opportunity to investigate ways to process long-range radar data collected that included lunar SAR imaging and detection of 2001 FO32. The moon is a perfect candidate for such tests as it is an extremely useful radar calibration target. During the March 2021 testing period, we had an opportunity to observe asteroid 2001 FO32 as well, since it approached within 5.25 lunar distances.
Moon Observations
Consider the geometry in Figure 10. Because the Earth is rotating and the moon is moving in its orbit, the Doppler shifts vary as a function of position that scatter radar energy on the moon. In addition, since the linear frequency modulation on the radar signal has a defined, single-peaked autocorrelation function, processing can separate the radar return in range and range rate. Range corresponds to distance from Earth and range rate corresponds to the east-west position on the moon.

Figure 10 Earth-moon geometry.
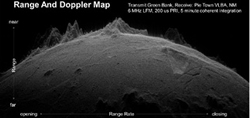
Figure 11 Image of the moon’s surface.
In Figure 11, the vertical extent corresponds to about 25 km, while the horizontal extent corresponds to over 100 km, meaning the curvature is highly exaggerated. A closer view is shown in Figure 12. Note that the inside of the crater in the foreground is visible. This is due to the mismatch between the radar geometry and the observer perspective. From the perspective of the image, the radar energy comes from the top and illuminates everything in its direct line-of-sight, including the inside of the crater. This is a common phenomenon in radar images since every point in the radar’s line-of-sight appears at a location in the image depending only on that point’s range and range rate. Because of this, the horizontal axis in the image corresponds to east and west on the moon, and the vertical axis corresponds to distance toward Earth; it is impossible to know if the image shows the north or south face of the mountains in the background. It may be showing both simultaneously.
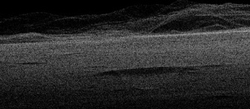
Figure 12 Closer view of the moon showing the inside of a crater in the foreground.
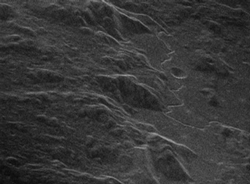
Figure 13 Apollo 15 landing site at 50 x 50 m resolution.
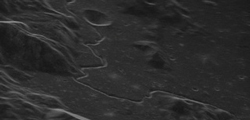
Figure 14 Apollo 15 landing site at 5 x 5 m resolution.
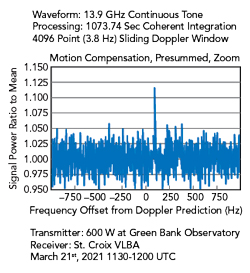
Figure 15 Doppler spectrum of the return from FO32 during the asteroid’s close approach.

Figure 16 Geometry of FO32’s closest approach to Earth.
When imaging regions of the moon away from the equator, the synthetic aperture created by the rotation of Earth can be exploited to form images. During a five-minute SAR collection, the GBT moves approximately 109 km. Using digital processing, an image can be formed equivalent to a real aperture of that size. The Apollo 15 landing site, shown in Figure 13, has a resolution of 50 x 50 m. With a longer dwell (40 minutes) and higher-bandwidth waveforms, higher resolution images can be formed, as shown in Figure 14 (Apollo 15 with a 5 × 5 m resolution). These images were processed using the Polar Format Algorithm (PFA).1 The PFA extends the available image size over Doppler-Delay processing, but itself has limitations on image size. Fortunately, correction algorithms are now available that enable larger and higher resolution images.
Asteroid 2001 FO32 Observations
During the asteroid close approach, the NRAO/RI&S team tested the Ku-Band transmitter with a variety of waveforms. Figure 15 shows the Doppler spectrum of the return from FO32 during one portion of this test. Because the asteroid has a large line-of-sight acceleration as it crosses Earth’s orbit, its Doppler shift is changing too rapidly for coherent integration based on an uncompensated Doppler spectrum. Figure 16 shows the geometry of the closest approach.2
At the closest approach, the relative range closure is zero. At five hours before the closest approach, the range rate was—10.3 km/sec (the total magnitude of velocity was 34 km/s.) Therefore at five hours before closest approach, the Doppler at a carrier frequency of 13.9 GHz was approximately 1 MHz and the rate of change of Doppler was roughly 50 Hz/sec.
Using the JPL Horizons tool,3 a fine-grained prediction of range rate was obtained and applied as a phase to the radar return before coherent integration. The result shows a peak within 100 Hz of the expected location. In a future planetary radar system, this extremely precise measurement could be used to update the orbital ephemeris of the object in real time.
CONCLUSION
The NRAO/RI&S/Qorvo experiments demonstrated the feasibility of GBT as a transmitter to enable radar observations while testing the potential of solid-state microwave technology. The data collected during these experiments using basic radar signal processing algorithms validates the feasibility of an NRAO radar using the GBT as a transmitter and the VLBA antennas as receivers. This points the way to a future, more capable planetary radar system that can provide precision orbit determination and high-resolution images of solar system objects. It has opened the path to a new development for planetary radar capabilities at the GBT that could lead to an effective radar instrument being planned and deployed in the coming years. Microwave technical capabilities are evolving where consideration of future high-power, multiple-frequency phased array systems could provide opportunities to bridge the gap of current radar systems for solar system exploration and more.
ACKNOWLEDGMENTS
The authors acknowledge Frank Ghigo (GBO retiree) for his dedication and guidance through the development, testing and observations phases conducted with the GBT Ku-Band transmission experiments. Associated Universities, Inc. operates both GBO and NRAO under a cooperative agreement with NSF.
References
- W. G. Carrara, R. S. Goodman and R. M. Majewski, “Spotlight Synthetic Aperture Radar Signal Processing Algorithms,” Artech House, 1995.
- Small-Body Database Lookup, Web, https://ssd.jpl.nasa.gov/sbdb.cgi?sstr=231937;orb=1;cov=0;log=0;cad=0#orb.
- Horizons Web Application, Web, https://ssd.jpl.nasa.gov/horizons.cgi.