
The next step was optimizing the design to reduce the noise figure, a process made simpler using the “discrete optimization” feature within the Microwave Global Models (see Figure 11). This feature makes it possible to perform discrete optimization, where the model’s part value is adjusted to the manufacturer’s “real life” part value.3 With this method, designers can indicate the range of part values within a part family to be included in the optimization. In this case, the discrete optimization feature was activated for C1 and L2, the components at the input of the PMA-5451+, to achieve the best noise figure. The optimization goal must be specified and the optimization itself configured. An optimization goal of 0.9 dB maximum noise figure - probably unrealistic - was set over the range from 3.3 to 3.8 GHz, and a discrete optimization performed, combined with tuning the microstrip interconnect lengths, to obtain the best noise figure over the n78 band. In addition, the values of the components at the output of the PMA-5451+, C2 and L1, were determined to achieve adequate output return loss. After optimization, the values were C1 = 2 pF, L2 = 27 nH, C2 = 3.6 pF and L1 = 3.3 nH (see Table 2).
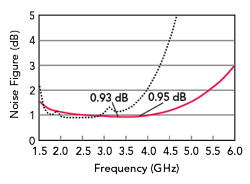
Figure 12 Simulated noise figure of the LNA before (dotted) and after (red) optimization.
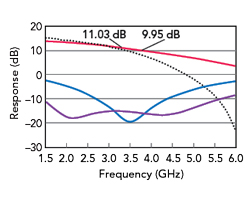
Figure 13 Simulated |S21| before (dashed black) and after (red) optimization, |S11| (blue) and |S22| (magenta).
Figure 12 shows the simulated noise figure of the optimized LNA design, comparing it to the simulated noise figure before optimization (from Figure 10). After optimization, the simulated noise figure was < 1.0 dB from 3.3 to 3.8 GHz. Figure 13 shows the simulated gain and return loss of the optimized LNA design. The stability factor was > 1 over the entire simulated frequency range from 50 MHz to 8 GHz. Figure 14 compares the Sopt data of the PMA-5451+ model to the reflection coefficient looking into the input matching network from the PMA-5451+. To achieve optimal noise figure from 3.3 to 3.8 GHz, the source reflection coefficient should be as close as possible to Sopt, which is shown in the figure.
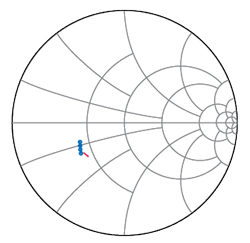
Figure 14 PMA-5451+ Sopt (blue circles) and reflection coefficient looking into the input matching network from the PMA-5451+ (red).
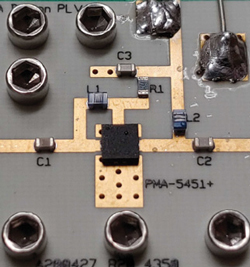
Figure 15 LNA assembly.
LNA MEASUREMENTS
The final step was validating the design by building and measuring the LNA; Figure 15 shows one of two units that were assembled and measured. The measured gain and return loss largely agree with the simulations (see Figures 16 and 17). Figure 18 compares the measured and simulated noise figure, including the simulated noise figure before optimization. One of the two measured LNAs had a noise figure < 1 dB from 3.3 to 3.8 GHz, while the noise figure of the second LNA was slightly higher, peaking at 1.06 dB at 3.8 GHz. We believe assembly variability and measurement sensitivity caused the higher noise figure and deviation from the simulation. Nonetheless, the results confirm that reducing the noise figure was achieved.
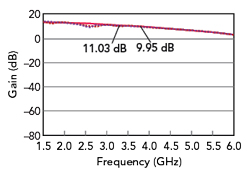
Figure 16 Measured gain of two LNAs (dashed) vs. simulated gain (red).
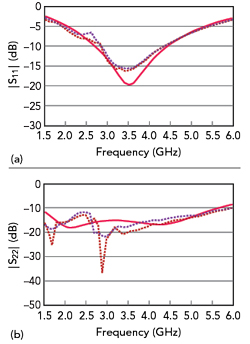
Figure 17 Measured vs. simulated |S11| (a) and |S22| (b). The dashed traces represent measurements of two LNAs; the red traces are simulated performance.
CONCLUSION

Figure 18 Measured noise figure of two LNAs (dashed) vs. simulation before (dotted black) and after (red) optimization.
The test results demonstrate a MMIC LNA can be optimized to achieve lower noise figure than specified in the manufacturer’s data sheet over a narrower frequency range. Designers can use this approach to achieve lower noise figure than specified for a MMIC. Modelithics amplifier models are well-suited for this approach because they enable designers to predict both S-parameters and noise parameters. Adding the ability to scale the model values of passive components makes it easy to optimize the passive elements to meet design goals.
References
- Guillermo Gonzalez, Microwave Transistor Amplifiers: Analysis and Design, Second Edition, Prentice Hall, New Jersey, 1997.
- S. Akamatsu, S. Muir and L. Dunleavy, “Simulation Procedures for Successful Low Noise Amplifier (LNA) Design Using Discrete Components,” High Frequency Electronics, 2012, pp. 22–30.
- “Discrete Optimization with Modelithics Models in ADS,” Modelithics, October 2018, Web, www.modelithics.com/Literature/Presentation.