

Vector network analyzers (VNA) are used throughout the microwave industry to measure the S-parameters of devices-under-test (DUT), quantifying how signals propagate through multi-port networks. S-parameters are often used to describe the critical performance characteristics of a DUT, including return loss, insertion loss, gain, VSWR and stability. What if the DUT cannot be directly connected to the test port of the VNA? In this case, an adaptation is required to cover the physical distance between the VNA and DUT and adapt between potentially different connector types and genders. In an ideal world, this adaptation would be transparent and have no impact on the measurement; however, in the real world, we must choose the best available interconnects - cable assemblies and adapters - that offer the lowest impact on the measurement system. A test port cable assembly is often the best choice, as it simultaneously offers flexibility in making the connection and adapting between different connectors, while minimizing the impact on the measurement.
An interconnect’s impact can be quantified by uncertainty; lower impact results in lower measurement uncertainty. To minimize measurement impact, Maury Microwave has developed its StabilityVNA™ series of test port cable assemblies, specifically designed to reduce measurement uncertainty and increase measurement confidence (see Figure 1).
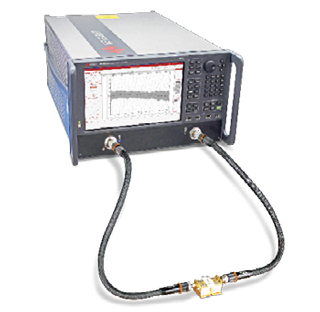
Figure 1 StabilityVNA cable assemblies connecting a DUT to a Keysight VNA.
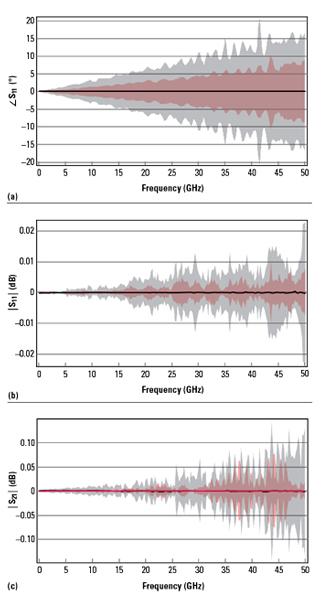
Figure 2 Measurement uncertainty comparing the StabilityVNA (red) and competitor (grey) cable assemblies: 1-port measurement with cable assemblies terminated with a short circuit (a) and 50 Ω load (b) and 2-port measurement of a low insertion loss airline (c).
REDUCING UNCERTAINTY
Historically, cable manufacturers represented low measurement impact by describing how little the signal changed with cable flexure, represented by a phase stability with flexure specification. While it is true that low phase change is critical to minimize the cable’s impact on a measurement, the method used to define the value is often ambiguous and does not represent the typical range of movement of the cable in a measurement system. It is also difficult to understand how a phase change specification translates to possible errors in S-parameter measurements.
A better way to describe the impact is to quantify the possible change in S-parameters when flexing the cable assembly. This quantified range of potential changes in measurement results is referred to as measurement uncertainty.1,2 Maury launched the software platform Insight™ to provide a practical approach to characterize measurement uncertainty and apply it to the S-parameter measurements made with any commercial VNA.3
Every VNA user’s goal should be reducing measurement uncertainty and the differences in S-parameter measurements to have more confidence in the measurements. The StabilityVNA test port cable assemblies were designed specifically to reduce measurement uncertainty and increase confidence. Figure 2 compares the uncertainty contributions between the StabilityVNA and the industry’s leading test port cable assembly, showing single-port measurements with the cable assembly terminated with a short circuit and 50 Ω load and a two-port measurement of a low insertion loss airline.
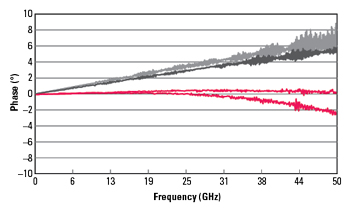
Figure 3 Measured phase change with flexure, comparing StabilityVNA (red) and industry leader (grey) cable assemblies.
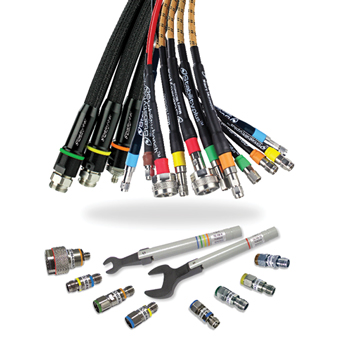
Figure 4 The StabilityVNA joins a comprehensive family of Maury color-coded interconnects, including cable assemblies, adapters, attenuators and torque wrenches.
While uncertainty may be the best way to describe a cable assembly’s impact on a measurement, phase stability with flexure is the most significant contributor to the overall uncertainty. Many methods are used across the cable industry to quantify phase stability. To eliminate ambiguity, Maury’s test process is as follows:
- First, the cable is terminated with a short. With the cable in a straight position, the VNA is normalized.
- Next, the cable is coiled 180 degrees counterclockwise around a 4 in. diameter mandrel and held in position for one sweep, recording the maximum deviation over frequency.
- The cable is then coiled 180 degrees clockwise around the mandrel and held in position for one sweep, recording the maximum deviation.
- Finally, the cable is returned to its original position for one sweep, and the maximum deviation is recorded.
Compared to other test methods, this represents the harshest test for phase stability with flexure. Even under these conditions, The StabilityVNA cable delivers the tightest phase stability performance currently available (see Figure 3).
COLOR-CODED
The StabilityVNA family uses the IEEE standardized high frequency connector color scheme to easily identify the connector type and frequency, mateability and torque requirements for accurate and repeatable connections. Maury has been offering color-coded interconnects since 2013 (see Figure 4).4 Color-coding makes it straightforward to avoid damaged equipment, degraded performance and equipment reliability and lengthy maintenance times caused by improper mating or attempted mating of incompatible connectors.
StabilityVNA cable assemblies offer best-in-class electrical and mechanical specifications, with models for 26.5, 40 and 50 GHz using 3.5, 2.92 and 2.4 mm NMD and standard connectors, respectively.5,6 Both in-series and between-series configurations are available, which is important for 5G systems in the FR2 bands, where DUTs with 2.92 mm connectors may be measured on a VNA with 2.4 mm connectors. The assemblies have typical VSWR of 1.18:1 to 26.5 GHz and 1.25:1 to 40 and 50 GHz, with the lowest phase stability with flexure: typically ±2 degrees to 50 GHz for 25 in. assemblies and ±2 to ±4 degrees for 38 in. and longer lengths. Both attributes yield lower measurement uncertainty. With a flex life of over 50,000 cycles, the SV-series reduces the cost of test. Although extremely flexible, armoring makes the cable assembly difficult to damage, with crush resistance greater than 839 lbf/in.
References
- M. Zeier, D. Allal and R. Judaschke, “Guidelines on the Evaluation of Vector Network Analyzers (VNA),” EURAMET Calibration Guide, No. 12, Version 3, 2018, www.euramet.org/publications-media-centre/calibration-guidelines/.
- T. Buber. P. Narang, G. Esposito and S. Padmanabhan, “Characterizing Uncertainty in S-Parameter Measurements,” Microwave Journal, October 2019, www.microwavejournal.com/articles/32951-characterizing-uncertainty-in-s-parameter-measurements.
- O. Ceylan, “S-parameters with Uncertainties. A New User-friendly Approach to Improve Confidence in Your Measurements,” IEEE MTT-S International Microwave Symposium, August 2020, https://youtu.be/vQNrTVsXpVo.
- S. Dudkiewicz, “Connect with Confidence, Color-Coded Interconnects,” Microwave Journal, Vol. 56, Ed. 3, March 2013, www.microwavejournal.com/articles/19315-connect-with-confidence-color-coded-interconnects.
- StabilityVNA™ Test Port Cable Assemblies Data Sheet, 2Z-002, www.maurymw.com/pdf/datasheets/2Z-002.pdf.
- StabilityVNA™ Test Port Cable Assemblies www.maurymw.com/store/Stability-VNA-Cable-Assemblies.
Maury Microwave
Ontario, Calif.
www.maurymw.com
+1-909-987-4715