
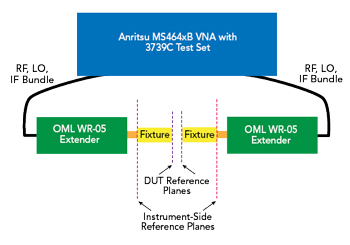
Figure 1 De-embedding measurement setup.
As higher frequency mmWave measurements are increasingly needed, there is a corresponding need for robust de-embedding techniques to reach device-under-test (DUT) reference planes accurately and to account for fixture, radiator and launcher behaviors. While most lower frequency techniques still work in principle, connection repeatability becomes much more of a challenge at higher frequencies, and greater bandwidths are available as well, so optimal techniques may change. This article examines some popular choices and experimentally looks at performance in some WR5 fixtures from 140 to 220 GHz.
Many classical de-embedding extraction techniques rely on explicitly solving for the S-parameters of the fixture or interposing networks.1-5 These can work very well, particularly at lower microwave frequencies if the standards that are used at the DUT plane are adequately defined and connection repeatability is sufficient. Examples of these techniques include generalizations of adapter removal,6 where a pair of full calibrations at inner and outer planes solve for the network parameters; one-port removal, often termed Bauer-Penfield1 from an early paper, where one-port calibrations are used to complete the solution; and traditional calibration methods such as thru, reflect, line (TRL).7,8
At higher mmWave frequencies (greater than 100 GHz), these methods face increased challenges as standards definition is affected more by machining tolerances and repeatability. If the reference planes are based on variations of the common UG387 flange, alignment tolerances are such that repeatability degrades rapidly above a few hundred GHz.9-11 This has led to a class of de-embedding methods where assumptions about the fixture are used to substitute for some of the measurements. The argument is that by using less repeatability-sensitive data, while keeping the less sensitive measurement data that is still important, net accuracy is improved. The assumptions can include symmetry - and almost always include reciprocity - and that mismatch centers are not located too close together.12-16 The latter is addressed in this article, where the phase resolution afforded by wide waveguide bands allows the extraction process to separate out dominant mismatch mechanisms and create something between a black box analysis and a pure model fit to the fixture.
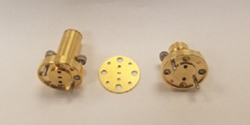
Figure 2 Waveguide calibration components, left to right: load, offset short shim, flush short.
The measurement setup is shown in Figure 1. It comprises a vector network analyzer (VNA), the Anritsu MS464XB and mmWave extension heads, the WR05 from OML, to allow measurements from 140 to 220 GHz. Most of the conclusions apply to other mmWave bands, with the repeatability condition becoming more important at higher frequencies. The fixtures that are extracted all have standard UG387 flanges on the instrument side and modified flanges on the DUT side, to support DUT mounting. Short, short, load (SSL) and short, short, short (SSS) calibration standards are used in most cases, with modified offset shorts being used at the DUT plane.
CALIBRATION STANDARDS CONSTRUCTION
Due to the influence of the calibration and de-embedding standards on the extracted results, it is useful to look at how the waveguide calibration standards at the instrument reference planes are fabricated. Three essential waveguide calibration standards are needed for TRL error correction in calibrating the VNA: waveguide load, waveguide offset line and waveguide short, which are representative of needs for many other calibration methods (see Figure 2). Precision alignment hole locations, waveguide aperture dimensions and offset line length are critical parameters for defining these standards.
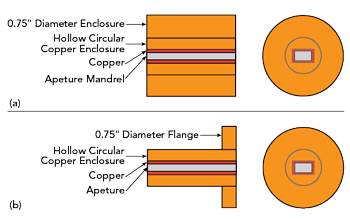
Figure 3 Offset line (a) and precision load (b) construction.
Quality calibration load and offset line waveguide apertures are often manufactured using an electroforming technique. The electroforming process starts with a precision machined waveguide aperture mandrel, with the mandrel tolerance usually better than 0.0005 in. and a 16 μin. finish is possible. With polishing, the surface finish can be less than an 8 μin. mirror finish and a 0.0002 in. or better accuracy. Once the mandrel passes mechanical inspection, it is submerged in a copper solution where copper attaches and thickens around it through a chemical process. It is rinsed and cleaned after reaching the desired copper thickness and is brazed into a hollow circular copper or brass enclosure. For offset lines, the brazed part goes through another brazing step for a final 0.750 in. diameter (see Figure 3a). Similarly, one end of the waveguide load goes through another brazing stage to attach a 0.750 in. diameter flange (see Figure 3b). The machined aperture mandrel is chemically removed. The part is cleaned, the interface flange is machined per MIL-DTL 3922/67 and OML precision anti-cocking flange specification control drawings. The waveguide offset line is cut to λ/4 at the center of the waveguide band of interest, and the waveguide precision load is cut to a predetermined length. Both the offset line and the waveguide precision load interface are polished to a 16 μin. finish or less. The part is then gold plated after passing mechanical inspection. The waveguide short is a machined part, with its flange configured per MIL-DTL 3922/67 and precision flange specification drawings. The waveguide short flange interface is polished to an 8 μin. mirror finish or better.
Once gold plated, the parts must pass final mechanical inspection. In addition, the aperture dimensions and the offset line length must be within ±0.0002 in. tolerance. Machining and process precision help to reduce uncertainties at the instrument reference planes of Figure 1, resulting in a low insertion loss - often on the order 0.1 dB - with a correspondingly high return loss. Such mechanical precision at the inner fixture DUT reference planes may be much more difficult to achieve, which drives the need for an optimal technique for de-embedding.
ONE-PORT TECHNIQUES

Figure 4 One-port BP method calibration.
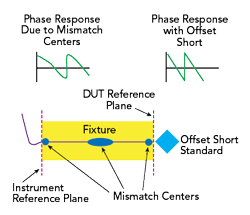
Figure 5 Reflection-based, phase localized extraction calibration.
One-port methods are among the simplest to execute, since an interconnection between ports is not required. A common classical family often goes by the name Bauer-Penfield (BP).1 As shown in Figure 4, a full one-port calibration is performed at the instrument side of the fixture, and another calibration is performed at the DUT side. Assuming reciprocity, the fixture S-parameters are then explicitly determined. In the following, this is labeled BP3, as in three standards are used at the DUT plane. As discussed in the literature,6 the DUT side match of the fixture is somewhat sensitive to standards quality, but the losses in the fixture here are low, so the input and output match behaviors convolve. Insertion loss extraction is derived from the two reflection tracking terms, so the high reflection standard behaviors are particularly important. By using an SSL kit on the instrument side plane, the load standard has little impact on loss extraction. By using an SSS kit on the DUT side, all the standards have roughly equal sensitivities.
A variation on the basic BP approach is to use two standards - often two different high reflections - if insertion loss is the primary quantity of interest. There are some variations on this, including those that assume symmetry and those that assume the fixture is electrically short, as in the on-wafer case.3 The fixture used in these measurements is not electrically short, i.e., greater than 10λ at mid-band, so symmetry is assumed used and labeled BP2 in the plots to follow. A partial information method used in this work is based on a single reflection measurement through the fixture14,16 after a full calibration at the instrument plane. The reflection coefficient of the standard at the DUT plane, an offset short in this case, is assumed known. The measured reflection data through the fixture is correlated with a series of propagation kernels to separate the portions of the response due to the reflection standard from those due to the internal mismatch centers (see Figure 5). Because the separate identification of the centers is based on phase resolution, there is a limit when a mismatch center near the DUT interface cannot be separated from the reflection standard. The resolution is proportional to the reciprocal of the sweep width, which is 12.5 ps for the WR5 waveguide band. The results from this approach are labeled “phase localized” in the measurements to follow. Related approaches using time-domain processing also exist.
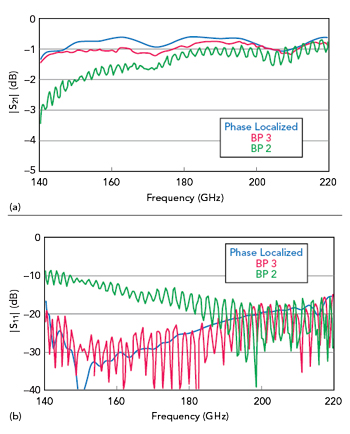
Figure 6 Extracted fixture |S21| (a) and |S11| (b) comparing the phase localized, BP2 and BP3 one-port methods
ONE-PORT MEASUREMENTS
Using the test setup of Figure 1, all three methods were used to extract the fixture parameters. |S21| is plotted in Figure 6a. BP2 produces the least physical result which might be expected since the fixture is not particularly symmetric, and the match is not excellent. The phase localized and BP3 methods produce similar results. BP3 has a 2σ repeatability of the extracted |S21| of ±0.25 dB. The 2σ repeatability of the phase localized result is ±0.11 dB.
Extracted |S11| on the instrument side is plotted in Figure 6b for the three methods. The BP2 result is again clearly deviant, most likely because of the assumption of underlying symmetry. Again, the BP3 and phase localized methods agree reasonably well within repeatability and calibration kit uncertainties: ~5 dB at -20 dB reflection.