
VARIANTS AND IMPROVEMENTS
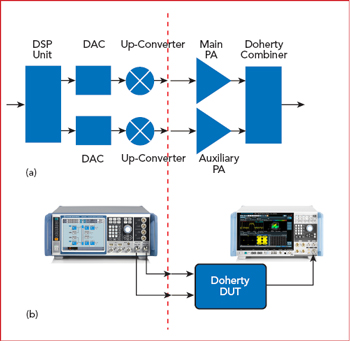
Figure 6 Simplified block diagram (a) and hardware setup (b) for designing a digital Doherty amplifier.
The following variations on the basic concept may be more appropriate for some applications and, with the classical implementation, offer the designer performance and flexibility options.
- Multiple gain stages inside the Doherty splitter and combiner.
- N-way Doherty.
- Intentionally dispersive splitter.
- Programmable splitter.
- Bias modulation.
- Supply modulation, i.e., adding a third efficiency enhancement technique to the two leveraged by Doherty.
- Envelope shaping.
- Digital Doherty.
In addition to the different architectures available to the designer, three points in the product life cycle allow adjustments. During the design phase, the design parameters can be modified, recognizing the parameters will be passed to production as fixed values (e.g., the input splitter design). During production, the parameters may be modified or tuned, typically based on measured data, and then frozen or fixed through programming. One example is the nominal bias voltage used to generate the target bias current in the devices. Once the equipment is deployed in the field, parameters may be updated, either continuously or at specific times, either open or closed loop. Open loop concepts rely on sufficiently predictable behaviors, while closed loop concepts might require built-in measurement and control. One example is circuitry for temperature compensation. These product life cycle options provide a plurality of solutions with no “best” solution. It is just as important for the designer to be aware of the manufacturing and supply capabilities following the design as the design challenges and trade-offs made during the design phase.
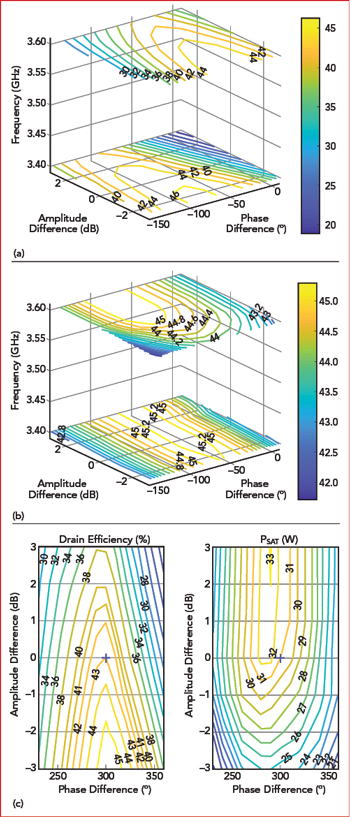
Figure 7 Dual-input Doherty in linear operation: measured efficiency at 35.5 dBm (a), saturated power (b) and worst-case efficiency and power (c).
At the opposite end of the solution spectrum from the zeroth embodiment is the digital Doherty (see Figure 4). This architecture is characterized by an input split which stretches back into the digital domain, prior to the digital-to-analog conversion. The ability to apply digital signal processing to the signal applied to both amplifier paths potentially gives unsurpassed performance from a set of RF hardware. Compared to the standard Doherty implementation, the digital version can achieve 60 percent greater output power, 20 percent more efficiency and 50 percent more bandwidth without degrading predictive, pre-correction linearity.12
MEASUREMENT-AIDED DESIGN FLOW
To optimize any Doherty design, it is advisable to build simulation environments that correlate well with the design, to understand trends and sensitivities. The simulation enables a significant part of the development to be covered quickly. Inputs to the first step might include load-pull data or models for the candidate devices, a theoretical study of the combiner and matching network responses, evaluation boards with measured data or other empirical data. Building on this starting point, the design flow can be supplemented with measurement-aided design (see Figure 5).
For the digital Doherty, the starting point for this approach is a Doherty comprising two input ports, input and output matching networks, active devices, bias networks and the Doherty combiner (see Figure 6). Measuring the prototype Doherty as a dual-input device provides greater insight into the performance limitations, trade-offs and reproducibility expected in a production environment. Critical to the test set-up are two signal paths, whose signals may be varied relative to each other. In addition to applying precise, stable and repeatable amplitude and phase offsets to the signals, it is advantageous to be able to apply nonlinear shaping to at least one of the signal paths.
The measurement algorithm may be rapid or more exhaustive, programmed to seek the optimum values for desired parameters or configured to characterize a wide range of parameters. In a simple case, the designer may want to confirm the best-case quantities and their relative amplitude and phase balance values. More complicated, a detailed sweep to enable a sensitivity analysis or rigorous solution space search may be warranted. The post-processing of these measurements can be as simple or sophisticated as the user wishes.
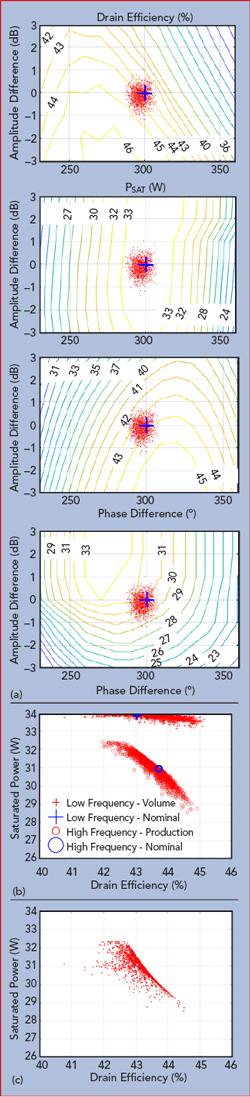
Figure 8 Gain and phase variation of a population of split digital Doherty amplifiers with a fixed RF input (a), saturated power and efficiency using a look-up concept (b) and cumulative, worst-case production distribution (c).
CASE STUDY
To demonstrate the design flow and achievable results, a digital Doherty PA for a 3.5 GHz, 5G New Radio (NR) base station was designed using a single stage unmatched GaN power transistor, the Qorvo®TQP0103. A dual-path R&S®SMW200A vector signal generator provided the two input signals to drive the GaN amplifier. For measurement of dependent quantities, the single RF output of the amplifier was connected to an R&S®FSW Signal Analyzer. DC power for the devices was sourced from an R&S®HMP power supply, which measured the DC power consumption. The amplifier was stimulated using differentially linear and nonlinear signals, the former sweeping the input power, amplitude and phase. The nonlinear tests used a variable shaping function, amplitude dependent, at two frequencies. Output power, output peak-to-average power ratio, adjacent channel leakage ratio (ACLR) and current consumption were measured, and the measurement results were analyzed using MATLAB®.13
Analyzing the linear measurements, efficiency at a specified power level and saturated power were plotted versus the amplitude and phase differences (see Figure 7), with the worst-case efficiency and output power shown in Figure 7c. In the basic Doherty embodiment, a quasi-constant amplitude/phase split is chosen for the operating frequency. The efficiency and saturated power for these amplitude/phase values can be determined by extracting the worst-case performance at the test frequencies.
Selecting a nominal amplitude/phase split, a perturbation representing the natural variation in production may be added to the evaluation. Using a look-up table, the bulk effect of these part-to-part variations can be observed, as shown in Figure 8. Figure 8a shows the drain efficiency and saturated output power at two frequencies, Figure 8b shows the estimated production spread of saturated output power and drain efficiency versus the nominal values for the same two frequencies. Figure 8c shows the cumulative production spread, aggregating the results from the two frequencies. Paradoxically, in this case, most of the part-to-part variation is in the target variable, efficiency.
By adopting an alternative approach to the input splitter design, this variation can be reduced. Using a dispersive input splitter design, meaning using different amplitude and phase differences at the two design frequencies, advantageously enables the stacked contour plots shown in Figure 8a to, in effect, slide over one another. Using the same part-to-part variation data with this dispersive splitter design yields a better result (see Figure 9), with a higher mean efficiency and lower standard deviation.
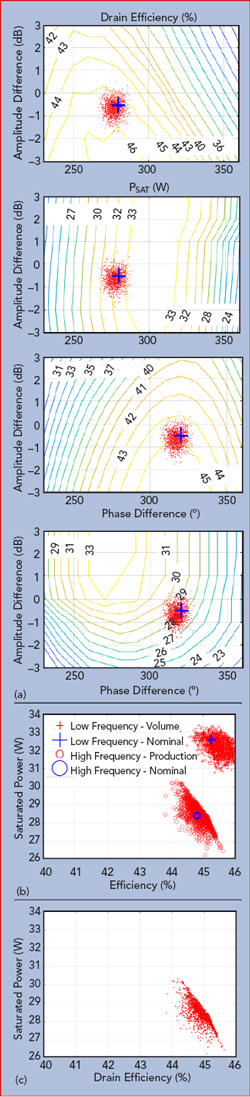
Figure 9 Digital Doherty amplifier population using a dispersive input split: gain and phase variation (a), saturated power and efficiency (b) and cumulative, worst-case production distribution (c).
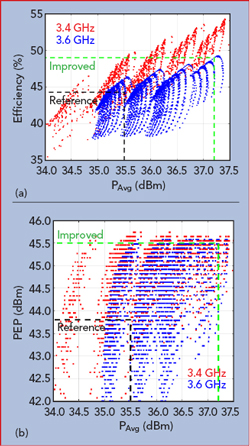
Figure 10 Efficiency vs. average output power (a) and PEP vs. average output power (b) for a dual-input Doherty amplifier using with square-law shaping and randomized phase.
By directly generating signals for the two amplifier inputs in the digital domain, the deficiencies of the Doherty amplifier are significantly reduced. Additionally, the simple part-to-part amplitude/phase variations shown in the linear example may be eliminated. To illustrate this, albeit not exhaustively, the auxiliary path was programmed with a square law shaping function applied to both the amplitude and phase, with the phase “start” and “end” values - the phase with zero and maximum input amplitude - varied randomly. With a common bias for the two amplifiers, only a trade-off between output power and efficiency remains, rather than those and the Doherty difference engine magnitude.
To establish a baseline, driving the commonly biased amplifiers with a linearly differential signal enabled the equivalent “balanced” performance to be ascertained: the available saturated output power in this mode was 0.5 dB higher than the differential biased case (12 percent higher power). That represents the “cost” of operating the Doherty engine using differential bias points. The scatter plot of random shaping functions applied to the auxiliary path yields the locus of performance shown in Figure 10, reflecting the distributions of average power versus efficiency and peak envelope power (PEP) versus average power. The saturated output power is 1.7 dB higher than the conventional Doherty amplifier (48 percent higher power), suggesting that 1.2 dB of the improvement (32 percent) is from better amplitude/phase matching of the signal paths.
The 1.7 dB improvement in saturated output means the amplifier may be operated at that increased output power without compromising headroom, and the increase in average power is associated with a 5 point increase in efficiency (from 44 to 49 percent). Alternatively, devices with 48 percent smaller periphery may be used to achieve the original target output power. Taking into account the expected part-to-part variation, this reduction in device periphery might be reduced further.
CONCLUSION
Significant improvements in Doherty performance can be achieved by addressing the input side of the design. The use of either an intentionally dispersive or programmable input split can improve performance, especially considering manufacturing distributions. According to peer reviewed research,12 the digital Doherty with nonlinear input splitting or shaping can achieve 60 percent more output power, 20 percent more efficiency and 50 percent greater bandwidth without any degradation in predictive linearization. The case study described in this article achieved 47 percent higher output power and 11 percent greater efficiency over a fixed bandwidth.
A measurement-aided methodology for extracting and understanding possible improvements was demonstrated. While efficiency and saturated power served as examples, they do represent the two most important parameters in most Doherty designs. Regardless of which Doherty architecture is used, this design methodology provides more detailed and rigorous insight and improves both time-to-market and the cost-specification paradigm.n
Acknowledgments
The author would like to express gratitude to Jeff Gengler, Tammy Ho Whitney and Bror Peterson at Qorvo.
References
- H. S. Black, “Translating System,” U.S. Patent 1,686,792, October 9, 1928.
- H. S. Black, “Wave Translation System,” U.S. Patent 2,102,671, December 21, 1937.
- A. B. Clark, “Electrical Picture Transmitting System,” U.S. Patent 1,619,147, November 13, 1928.
- P. G. Lloyd, “Linearization of RF Front-End,” Rohde & Schwarz GmbH & Co., November 2016, www.rohde-schwarz.com/appnote/1MA269.
- H. Chireix, “High-Power Outphasing Modulation,” Proceedings of the Institute of Radio Engineers, Vol. 23, No. 11, November 1935, pp. 1370–1392.
- R. L. Kahn, “Single-Sideband Transmission by Envelope Elimination and Restoration,” Proceedings of the Institute of Radio Engineers, Vol. 40, No. 7, July 1952.
- W. H. Doherty, “A New High Efficiency Power Amplifier for Modulated Waves,” Proceedings of the Institute of Radio Engineers, Vol. 24, No. 9, September 1936, pp. 1163–1182.
- J. Choi et al., “Optimized Envelope Tracking Operation of Doherty Power Amplifier for High Efficiency over an Extended Dynamic Range,” IEEE Transactions on Microwave Theory and Techniques, Vol. 57, No. 6, June 2009, pp. 1508–1515.
- C. M. Andersson et al., “A 1 to 3 GHz Digitally Controlled Dual-RF Input Power Amplifier Design Based on a Doherty-Outphasing Continuum Analysis,” IEEE Transactions on Microwave Theory and Techniques, Vol. 61 No. 10, October 2013, pp. 3743–3752.
- S. Chung et al., “Asymmetric Multilevel Outphasing Architecture for Multi-Standard Transmitters,” RFIC 2009.
- S. C. Cripps, “RF Power Amplifiers for Wireless Communications,” Artech House, Norwood, Mass., 2006.
- Darraji et. al, “Doherty Goes Digital,” IEEE Microwave Magazine, September 2016.
- “The Dual-Input Doherty,” Rohde & Schwarz, www.rohde-schwarz.com/us/campaign/premium-download-the-dual-input-doherty/premium-download-the-dual-input-doherty_233590.html.