
Low Cost Antenna Measurement Systems
HVS Technologies Inc.
State College, PA
|
|
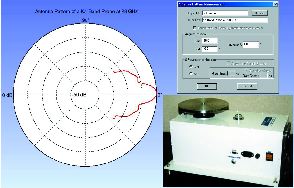
A new family of low cost systems for antenna pattern measurements has been developed. These systems, shown in Figure 1, come with complete hardware and user-friendly software for making quick, accurate and cost-effective measurements of antenna patterns. The measurement systems are less expensive and easier to use than other similar systems, and offer users the option of using a variety of microwave instrumentation so that the system may easily be integrated with the user's equipment. They are particularly suited for testing microwave antennas and multi-channel and local channel multipoint distribution system fixed wireless consumer premises equipment transceivers and outdoor units of the broadband wireless access industry.
These measurement systems can provide complete angular coverage of the test antenna's field (magnitude and phase) in the azimuth plane. The software can control various commercially available network analyzers used to transmit and receive microwave signals from the test and probe antennas. The software completely automates the calibration process, as well as data acquisition and data plotting functions (polar, linear and surface plots). The user can either make single point (Fast C.W.) measurements or sweep over a frequency range and implement time domain gating to remove multiple and spurious reflections.
Figure 2 shows a block diagram of the antenna measurement system. The complete system consists of an azimuth positioner, vector network analyzer, computer, probe antenna and test antenna. The azimuth positioner is connected to the computer through an RS232 port. The positioner also has a hardware kill switch connected in case the system needs to be stopped immediately in case of an emergency. The positioner has adjustable feet and a level indicator to ensure that the antenna under test (AUT) is in the azimuth plane. The AUT is mounted on the turning plate as shown in the figure. A proximity switch is incorporated in order to define the home position. The probe antenna and AUT are connected to a vector network analyzer. When the turning plate is in the home position, the two antennas are facing each other and this position is defined as 0°.
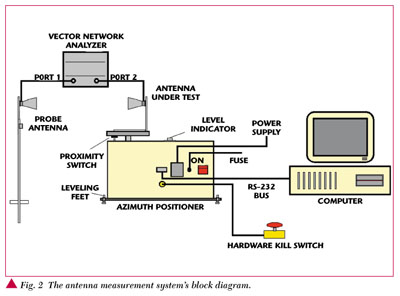
The antennas and measurement system are calibrated using the response calibration technique when the AUT is at 0°. To make antenna pattern measurements, the probe antenna is supported fixed in space, while the AUT is mounted on the azimuth positioner and stepped in angle in the azimuth plane. At each angular position, the complex transmission coefficient (amplitude and phase) is recorded from the network analyzer.
The measured transmission coefficients (magnitude or phase) are then plotted as a function of azimuth angle in linear or polar plots, called antenna pattern plots. In case of swept frequency measurements, the transmission data can be plotted as surface plots as a function of both frequency and angular position.
Three models (AMS1, AMS2 and AMS3) are available that can accommodate antennas up to 500 lbs. The main features include a one axis position controller with RS232 interface and azimuth positioner with 0.1° accuracy. This system has an integrated positioner and controller unit, and integrated reduction gear with low backlash. Control of various commercially available network analyzers is via GPIB interface. The automation software is for Windows 95/98/NT or later, and features user-selectable, software-controlled limit switches and home position. The system outputs integrated polar plots, linear plots and surface plots (swept frequency measurement), and is capable of automated calibration. Measurements of 3-dB beam width, side lobe levels, and location of maxima and nulls are produced. In addition, the system has an integrated software kill switch and an optional hardware kill switch. The specifications of the antenna measurement systems are listed in Table 1.

RESPONSE CALIBRATION
Before the HVS antenna pattern measurement system can be used to make precise measurements, the network analyzer and antenna (NWA) system must be calibrated. The response calibration technique is employed for this purpose.
The required frequency band of operation can be selected, or if the user desires, a user-defined range can be specified. If the user desires to make measurements at a single frequency point (Fast C.W.), then User Defined must be chosen and the desired frequency must be entered for both the Start and Stop Frequencies.
Next, the number of points into which the frequency range will be divided is determined. If the user chooses a single frequency point for measurements, then only the Single Point option will be enabled. If a frequency range is selected, then Single Point will be disabled and the remainder of the choices will be available to the user.
The larger the number, the more time it will take to perform the calibration and subsequent measurements. If not selected, a default value of 51 will be assumed for the number of points.
Next, the averaging factor is used to minimize the time variant errors in the NWA. If a high value is chosen for the averaging factor, the accuracy of the measurements will be better; however, it will also take longer to make the measurements. An averaging factor of eight is used as the default.
At this point all the pre-calibration details would have been taken care of and pressing Finish will take the user through the actual calibration procedure. The Back button can be used to go back and change any option and the Cancel button can be used to abort the calibration procedure.
When the Finish button is pressed the actual calibration of the system starts and the options chosen during pre-calibration are set on the NWA.
When calibrating up to the end of the coaxial cables, the two coaxial cables must be connected to each other as in a THRU measurement. If two antennas are connected to the coaxial cables, then they must be copolarized and normal to each other. When the measurement of THRU Standard is finished, the error coefficients are computed and stored in the NWA, which are subsequently applied to new measurements. When the calibration is completed, the system instructs the user to set up the system for the THRU Standard in order to verify the calibration.
After setting up the prompted Standard the NWA is instructed to take a single sweep across the selected frequency range using the chosen number of points and averaging factor. The measurement is then compared to a predetermined criteria. If the measurement conforms to the criteria, a message appears indicating that the response calibration is done. If the criterion fails, a message box appears telling the user that the calibration has failed. If the calibration fails, the user must check to ensure that the cables and antennas are configured properly for the calibration range and then the response calibration procedure is repeated.
PATTERN MEASUREMENT
|
|
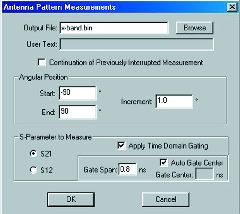
This module is accessed from the antenna pattern menu and is used to measure the S-parameters of the test antenna over various angular positions. The dialog box shown in Figure 3 is presented to the user. The output file contains the pattern data of the AUT. If swept frequency measurements are made over the angular position, the file is saved in a binary format. If single frequency point measurements are made, then the output file is saved in ASCII format and is compatible with the polar and linear plot modules. Options are available to extract discrete frequency data from the binary file, which can then be plotted using polar and linear plot modules. The user can enter any information on the measurement in the user text box, and it will be stored in the output file. This capability is available only when making single frequency point measurements.
The start, end and increment angular position values must be specified in order to make the measurements. The software then measures the antenna pattern of the AUT over these angles using the increment value specified. The minimum increment value must be at least 0.1° and the maximum number of angular points must be less than 720.
The user has the option of choosing either S21 or S12 (depending on the NWA used) and the chosen S-parameter data is then stored in the output file, which can then be used for further processing. Again, depending on the NWA being used, the user can choose whether or not to apply time domain gating on the measured S-parameters. If the user chooses time domain gating, the default gate span for transmission is 0.8 ns and gate center is automatically chosen. However, the user can enter any other desired values (in nanoseconds) for gate span and center. Time domain gating removes spurious reflections and multiple reflections between the probe antenna and AUT. This feature is useful when measurements are made outside an anechoic chamber. All functionalities dealing with the Network Analyzer are disabled when a pattern measurement is being carried out.
ANTENNA MEASUREMENT EXAMPLES
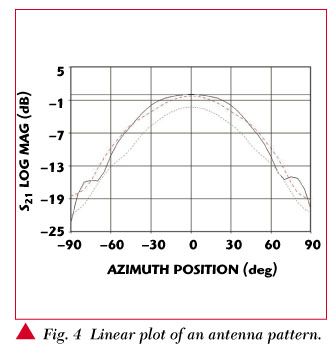
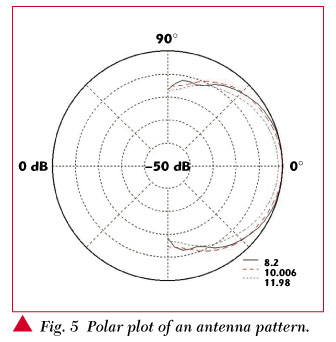
The pattern measurements can be displayed as linear plots, polar plots or surface plots (when swept measurements are made). The azimuth patterns of an X-band probe antenna at three different frequencies are represented as a linear plot and polar plot in Figures 4 and 5, respectively. The measurements were carried out using a swept frequency range of 8.2 to 12.4 GHz over an angular range of 90° to +90°. The data at the three frequencies (8.2, 10.006 and 11.98 GHz) are extracted from the binary file and plotted using the linear and polar plot modules.
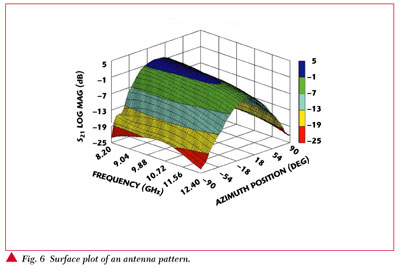
The binary output file from the antenna pattern measurements over a swept frequency contains all the data at all the frequencies and angular positions. The software converts this data into a surface plot file that is compatible with the surface plot module. Figure 6 shows a surface plot of the measurements carried out on the X-band probe.
CONCLUSION
A low cost, user-friendly antenna measurement system has been introduced that is capable of quick, accurate antenna pattern measurements. The system makes use of existing user instrumentation making implementation easier and less expensive. Additional information may be obtained from the company's Web site at www.hvstech.com.
HVS Technologies Inc.,
State College, PA
(814) 234-3833.
Circle No. 300