
Do you rely on accurate measurement of phase noise, amplitude or third order intercept (TOI) as part of your work? Would it surprise you to find out the accuracy of these and other critical measurements may not be what you expected, depending upon how your instruments are calibrated? If you submit your instruments for calibration and just assume good things will happen, your carefully constructed system accuracy budget could be ruined by instruments operating out of specification! Sounds bad – and it is! Unfortunately, what constitutes a proper calibration and the importance to everyday measurement accuracy is seldom taught in electrical engineering classes. This article illustrates how the accuracy of key measurements is directly related to specific calibration deliverables.
State-of-the-art phase noise measurements generally have to be performed with a dedicated phase noise test set. While still the only viable method for truly low noise sources, this technique is time consuming and requires significant technician skill. Fortunately, the local oscillators employed in modern spectrum analyzers frequently have sufficiently low phase noise to allow direct measurement of source phase noise. Figure 1 illustrates the progression of improved phase noise performance in recently introduced spectrum analyzers.
Figure 1 Trend of signal analyzer phase noise specification.
The phase noise of each of these instruments is tested thoroughly when manufactured. Sometimes you may hear “phase noise performance is an intrinsic design characteristic and doesn’t need to be checked during periodic calibration.” Certainly, modern instruments do have stable block diagrams. And yes, instruments with synthesized local oscillators connected to 10 MHz external references do not need to be checked for frequency accuracy. However, many other performance characteristics, such as phase noise, may be stable for several years, then degrade without warning and without obvious clues to instrument operation (think instrument heart disease).
Figure 2 Process monitoring of phase noise measurements on a signal analyzer calibration station.
Table 1 shows the phase noise specifications for the Keysight E4440A. Figure 2 shows the actual measured phase noise of a series of E4440A PSA units measured at the 100 Hz offset point. The test system in this case is one of the signal analyzer calibration stations at Keysight’s Roseville service center. Each symbol represents a different customer unit. Of course, the measurement is a combination of the reference source and the receiver performing the measurement. Note the sudden shift of approximately 11 dB beginning in January 2015. Either many units were suddenly not performing within the historical statistical process limits, or something happened with the reference source employed in this system. This service center has several such calibration stations, so experiments were performed with different reference signal sources and multiple measurements of the same test unit on multiple test stations. It was determined that the reference on this station was the source of the 11 dB degradation. As soon as the reference signal generator was replaced, subsequent test units were again measured within the historical process limits.1 The signal generator in question was in a rack, not moved or otherwise disturbed, prior to this 11 dB shift in performance. The root cause analysis of the failure mechanism had not yet been determined when this article was written.
Suppose the reference signal generator in the example was in one of your test systems. What would be the effect of >11 dB of lost production margin to your yield in a final production test system at your company or a test system used to characterize a new product design for transition from R&D to production? Seemingly stable instrument characteristics need to be periodically checked, just like doctors monitor blood pressure and cholesterol of seemingly healthy patients. Accurate periodic calibration of all the key specifications you count on is essential to ensure your critical measurements are as accurate as your system error analysis assumes.
Every calibration lab has a different level of commitment to maintaining lab standards. Suppose you are relying on the -136 dBc/Hz (@ 10 kHz offset) specification of the new Keysight N9040A UXA signal analyzer. The performance test requires a special reference oscillator. To be sure the current performance of your high end instruments is accurately measured, you should insist on a calibration report that includes both the instruments used and the test results. For any reputable calibration provider, this should be an easy request to satisfy.
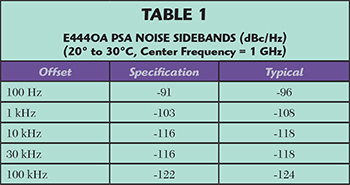
Figure 3 is an excerpt from the N9040A UXA help file specifying the equipment required for calibration. Hopefully it is obvious that high performance microwave instruments can only be calibrated properly with correspondingly high performance lab standards. For any high performance specifications you count on, you should be checking whether the instruments used to do the calibration are up to the task. You don’t have to do this yourself; ask your calibration provider if you have questions.
Third Order IMD (TOI) Measurements
An important specification for amplifiers is TOI performance. The test involves setting up two equal amplitude signals that are fed through a combiner to an amplifier under test (see Figure 4). The level of the signals depends on the amplifier’s gain, maximum output level and, of course, TOI performance. Generally, amplifiers are specified for the expected TOI at a given input level. With two input signals, any third order distortion products appear as shown in Figure 5.
If you already make TOI measurements, no doubt you are aware of the importance of isolating the two signal generators to avoid intermodulation via their output level control circuits. However, did you know that signal analyzers can change over time? There are mechanisms that can cause signal analyzer TOI performance to degrade. To illustrate, the video “Out-of-Cal Instruments Cause “Bad” Pass/Fail Decisions”2, shows a signal analyzer that was apparently functioning perfectly yet had TOI performance more than 5 dB worse than it should have – and was fine after it was repaired. So you may ask yourself, “Can I afford to lose 5 dB or more margin when testing my amplifiers for TOI?” If your answer is “absolutely not,” then check the calibration measurement report for your signal analyzer.
Figure 3 Excerpt from instructions for calibrating the Keysight X-series signal analyzer.
Table 2 shows one example of a TOI report. If your cal provider does not provide a measurement report or if that report doesn’t include TOI measurements, then you have no idea of the current TOI performance of your measuring receiver. Just like it takes two people to dance the tango, two microwave signal generators are needed to perform TOI signal analyzer measurements. If the instruments listed in your calibration certificate do not include two microwave signal generators, you know that TOI performance was not measured.
Adjusted to the Middle?
Many engineers assume that when they submit their instruments for calibration their unit will be adjusted for optimum performance every time. That is not true, not even for the original equipment manufacturer (OEM). What does happen is performance tests establish observed current performance. If the observed measurements are inside the specification limit and considered a “pass,” the unit is returned to the customer (see Figure 6). At Keysight, we measure the actual performance for every spec, every time in calibration. If a measurement is out-of-specification, then we perform adjustments. For engineers with long memories, the last adjustable resistor (rheostat) became extinct some 15 to 20 years ago. Since then, instrument manufacturers rely on digital-to-analog converters (DAC). This, with the same accurate external equipment used for measuring performance, allows for automated adjustment routines. These adjustments are often iterative for overall optimum performance. Power level accuracy adjustments in microwave signal generators can be as short as 30 minutes, though most models take two to four hours.
OEMs, including Keysight, do not publish the algorithms of these adjustment procedures. If your unit needs to be adjusted, you need to send it to the OEM. When units are observed out of spec as received, Keysight reports the measured performance so you can determine the impact that instrument may have had on your measurements. Also, if it were necessary to adjust your instrument and re-run the performance tests, you’ll receive the “as shipped” measured data so your instrument is fit for use again.

Figure 4 Test setup for measuring amplifier TOI.
Special Calibration to Improve Margin
All measurements contain errors. There is no such thing as a perfect measurement. That is why you develop a system error budget for important measurements. Calibration is the same – there are no perfect measurements. In the calibration world, measurement error is referred to as measurement uncertainty (MU). You can think of this as the standard deviation of all the errors combined in an appropriate fashion.3 For most instruments, if you then draw an interval of ± 2 MU about a measured value, the result is the familiar statistical 95 percent coverage interval.
Figure 7 illustrates a calibration measurement that is in specification. However, a portion of the 95 percent certainty range is outside the specification, meaning there is some risk that the true value is out of specification.4 On many instruments, Keysight offers a premium calibration service, termed “cal + uncertainties + guardbanding,” where adjustments are performed when necessary to ensure the 95 percent certainty region falls within the data sheet specification. Keysight’s service adjustments are the same algorithms that are used in production. For specifications that are critical to system error budgets, it is a good idea to request that those instruments receive Keysight’s “cal + uncertainties + guardbanding” service. This provides the greatest assurance that the instrument is operating near the nominal specification, with extra yield margin in production test systems.
Figure 5 Spectrum showing third-order intermodulation products.
Receiver Sensitivity
One of the most important specifications for any RF/microwave receiver is sensitivity. It is generally defined as the minimum signal level at the input which results in a minimum acceptable bit error rate, signal-to-noise ratio or other baseband criteria for minimum acceptable receiver operation. Good receivers have a sensitivity of better than 0.5 µV (-113 dBm). In the region near the specified receiver sensitivity, the acceptable baseband criteria often changes at twice the rate of the incremental change in input level. Thus, it is important to have the power level be as accurate as possible. An example of level accuracy is shown in Figure 8, for the N5183A microwave signal generator. The expanded measurement uncertainty (shown with the red brackets) is quite a bit smaller than the specification. This is due to the excellent performance of the signal generator and because of the digital IF and receiver option of the E4448A measuring receiver used for this test. Calibration labs sometimes use older spectrum analyzers with analog IF sections (e.g., analog IF filters and log amplifiers). This results in the expanded measurement uncertainty extending well beyond the specifications. Obviously, if the measurement uncertainty extends beyond the specification of the instrument being tested, there’s no way to know the actual performance. With large measurement uncertainty, it’s also impossible to make accurate adjustments to achieve the power level accuracy shown in Figure 8.
Figure 6 Work flow for calibration, repair and adjustments.
Conclusion
With several common, important measurements, the instruments you rely upon may perform out of specification, even though they may not drift evenly from year-to-year. Absent catastrophic failure, you have no way of knowing that performance has changed unless it is caught during periodic calibration. That’s the point of periodic calibration: to accurately measure the performance of your instrument and compare that with the original data sheet specifications. For the critical specifications that your organization relies on, review how your instrument performs during calibration. Waiting until one of the instruments is out of tolerance is too long. An instrument barely in tolerance can impact the pass/fail results of the end product. For additional test margin, consider a calibration service that incorporates uncertainties and a guard band.
Figure 7 Example of the 95 percent confidence range extending outside the instrument specification.
References
- The chart and associated data is part of the calibration measurement monitoring system (CMMS) as part of Keysight’s compliance with Paragraph 5.9.1 of IEC/ISO 17025. More information on CMMS is available at http://literature.cdn.keysight.com/litweb/pdf/5992-0037EN.pdf
- A series of short videos about calibration and how it relates making accurate measurements is available at www.keysight.com/find/servicevideos
- ISO/IEC Guide 98-3:2008, The Guide for Expression of Measurement Uncertainty
- There is a whole field of study to quantify probability density, consumer risk, producer risk, etc.
Figure 8 Power level accuracy of a N5183A MXG signal generator.
Bob Stern graduated from the University of Wisconsin with bachelor’s and master’s degrees in electrical engineering. Over his career, he has worked for six different divisions at Hewlett Packard, then Agilent, now Keysight Technologies. Stern participates on the National Conference of Standards Laboratories International (NCSLI) committees concerned with calibration standards, he is chair of the NCSLI 174 standards –writing group, and he recently began attending International Laboratory Accreditation Cooperation (ILAC) standards meetings. He is also active in efforts to align Keysight’s calibration service deliverables with IEC/ISO 17025, ILAC-G8, ILAC-P14 and ANSI Z540. He has recorded eight YouTube videos on various calibration topics.