

Intermodulation distortion (IMD) has become an important measurement during the design of RF and microwave amplifiers. Modulation techniques in communication systems have become more sophisticated, thereby requiring improved performance from amplifier and receiver circuits. Identifying third order (and higher) intermodulation distortion products (IPn) is as important as quantifying harmonic and second order distortion products since IP3 products are located in-band and cannot be easily filtered. The third order intercept point (TOI or OIP3) of power amplifiers is important to quickly identify the intermodulation characteristics of the active device.
During the design process, engineers often need to create accurate models of the device for simulation purposes. Accurate IMD data, including higher order products up to IM9, are used to generate accurate models and are critical to the success of amplifier design. An important aspect of accurate IMD measurements is the IP3 performance of the VNA receiver. The VectorStar receiver architecture, utilizing patented non-linear transmission line (NLTL) technology, provides industry-leading receiver IP3 performance for accurate IMD measurements. The wide range of important IMD measurements has traditionally been difficult to set up — requiring multiple test instruments combined with multiple components. The introduction of IMDViewTM and internal combiner options in VectorStar not only simplifies the setup procedure but also offers flexible hardware configurations for accurate and efficient IMD measurements over the widest range of frequencies available in a single system.
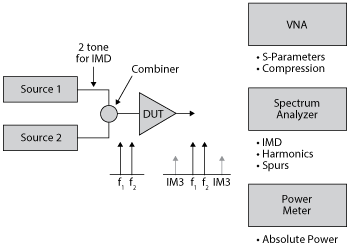
Figure 1 The traditional setup for amplifier testing requires multiple instruments.
Setting up IMD Measurements
Traditionally, measuring active devices required a VNA, spectrum analyzer and power meter in order to measure performance parameters such as gain, harmonics, compression and IMD characteristics (see Figure 1). A calibrated VNA can perform these measurements when configured with the proper options. For example, inclusion of independent frequency control of the sources and receivers provides the ability to measure different frequency points of interest when stimulating the device under test (DUT). Thus, measurements of harmonics and spurs as well as IMD products can be performed with the frequency offset option. An internal dual source option (Dual Source Option 031) provides the two tones needed for intermodulation measurements, eliminates the need for locating external sources, minimizes external cabling requirements and reduces setup time.
The two recently introduced VectorStar options for IMD measurements further extend the wide range of measurement possibilities. The internal combiner option (see Figure 2) provides the ability to automatically switch the path of the second source to the Port 1 side of the VNA. Thus, during S-parameter measurements the switch will be in the normal path through Port 2 to perform standard S-parameter, gain and compression tests of the active device. When a two tone IMD measurement is needed, the IMD software will control the switch and combine the two internal sources for a two tone input to the DUT. With the new VectorStar combiner option, IMD measurements can be made with a single connection without the need for re-cabling the measurement setup. This is a useful tool for reducing setup and measurement time and improving overall accuracy by reducing concatenation errors of multiple calibrations and system setups.
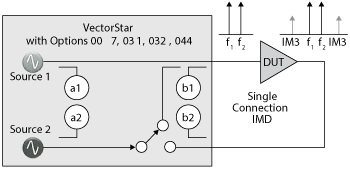
Figure 2 Hardware and software options enable VectorStar to replace the spectrum analyzer and power meter to measure S-parameters, power and IMD.
IMDView is the software that provides the graphical user interface (GUI) for setting up the IMD measurement. The software simplifies measurement complexity and controls the VectorStar hardware for the wide range of available measurements. Figures 3 and 4 provide a brief summary of some of the capabilities available. The measurement shown in Figure 3 is configured as a two channel layout. The top channel is sweeping the intermodulation tones and displaying parameters such as the relative power of the IM3 product and absolute power level of the main tones. In addition, OIP3 is calculated for the given power level and displayed as power over frequency. The bottom channel provides a spectrum analyzer-like display of the two tones and the products for a CW stimulus. This display is useful for validation of the measurement setup and confirming that the DUT is not oscillating in the current configuration.
Improved Device Modeling
Linearity, low noise and IP3 performance of the receiver are critical in acquiring accurate IMD analysis. The VectorStar NLTL-based receiver provides exceptional linearity while maintaining very low noise floors even at millimeter wave (mmWave) frequencies. Typical VNAs provide IP3 in the +25 dBm range and performance is reduced at narrow tone deltas, in some cases IP3 performance is reduced as much as 20 dB. VectorStar provides receiver IP3 performance in the 35 dBm range and continues to provide excellent performance even at narrow tone deltas. In fact, in combining the NLTL-based receiver with the source control capabilities of the VectorStar VNA, there is minimal difference in IP3 performance when measuring under wide or narrow tone deltas. Since the design engineer needs to stimulate the DUT under real-world modulation conditions for best accuracy, providing fewer restrictions during the IMD measurement process is a real advantage. Benefits of the NLTL receiver architecture also carry over into the mmWave bands providing industry-leading IP3 performance up to 145 GHz.
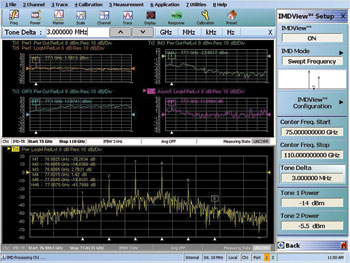
Figure 3 IMDView software controls all measurement parameters, enabling IMD analysis.
Measuring higher order products is important for tracking optimum spectral performance. IMDView provides easy configuration for tracking higher order products (up to IM9) and includes advance tracking capabilities such as asymmetry plotting. Trace 4 of Figure 3 is configured to plot the asymmetrical properties of the fifth order tones. This unique feature available in VectorStar provides the design engineer the ability to track the asymmetrical properties of the IM products for advanced analysis capabilities such as memory effects of active devices. The result is more accurate models of the device for improved circuit simulation and improved chance of first-turn design success.
Useful and Extensive Graphical Interface
The IMDView option provides a wide range of tools to help configure the IMD measurement. In addition to setting up the trace responses, the software provides extensive trace and channel management for easy display optimization. The software also tracks the frequency bands of interest as well as the power levels required of the two tones. During power calibration the software automatically switches the paths to reflect the required configuration for the power calibrations. The result is calibrated tone power at the input of the DUT and corrected for the loss paths through the combiner.
Improvements in trace and channel management also provide easy optimization of complex measurements. For example, setting VectorStar in the active channel only mode will update the display of the active channel and provide best measurement speed for the channel. If multiple response changes need to be monitored as the device is being tuned or while a parameter is being edited, then the feature can be quickly toggled for an all channel update.
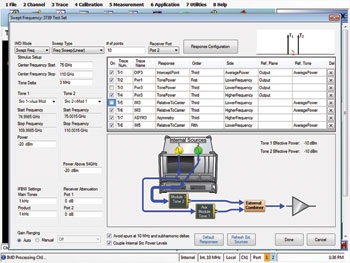
Figure 4 Setting up IMD measurement is simplified using the IMDView configuration panel.
mmwave IMD Measurements to 145 GHz
The VectorStar series platform offers the widest range of frequencies available in a VNA. Beginning with a start frequency of 70 kHz (operational to 40 kHz) the low end provides the ability to characterize amplifiers down to the actual operating condition of the DUT. Note that if the DUT operates to 10 MHz and the lower main tone is set for 10 MHz, then lower order products will be less than 10 MHz. Thus, a VNA capable of measuring signals below 10 MHz becomes even more important during IMD measurements.
At the upper end, the VectorStar series offers stop frequencies at 20, 40, 50 and 70 GHz for the baseband units. For single sweeps beyond 70 GHz, the broadband versions operate to 110, 125 and 145 GHz in coax. The Anritsu mmWave modules for IMD measurements are used as the source tones starting at 54 GHz and go up to the 110/125/145 GHz limit.
The IMDView configuration panel automatically monitors the system configuration and provides graphical setup solutions depending on whether the system is configured for baseband operation or mmWave operation. The GUI also tracks setup requirements for different version configurations such as when the combiner or dual source option is not included and external sources are preferred. Figure 4 shows the graphical configuration for measuring a W-Band 75 to 110 GHz DUT and provides all the parameter controls required. Figure 5 is an example of a typical VectorStar on-wafer mmWave IMD measurement. The high performance, compact modules offer excellent IMD performance for on-wafer measurements at mmWave frequencies in a configuration that is easy to install using smaller, low cost platens and positioners.
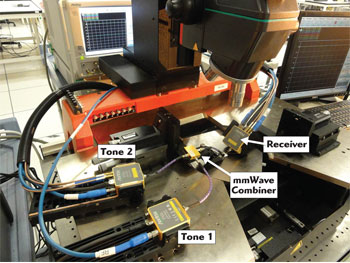
Figure 5 IMDView supports IMD measurements of mmWave devices.
IMDView software, together with an optional internal second source, provides the ability to evaluate intermodulation distortion performance of amplifiers during the design stage and in production. The VectorStar graphical user interface reduces test time by providing engineers the ability to modify parameters and observe the results immediately without needing to switch screen displays.
Anritsu Co.
Morgan Hill, Calif.
(408) 778-2000![]() (408) 778-2000
(408) 778-2000
www.anritsu.com
See Anritsu at IMS Booth 2438