
Power amplifiers (PA) are a critical component in mobile communication devices like smartphones and tablets. To increase data rates, mobile devices are operating ever wider bandwidths with multiple-input multiple-output (MIMO) data streams and higher-order modulation, and orthogonal frequency division multiplexing (OFDM). This requires the PA to achieve both better linearity and efficiency to ensure long battery life. Unfortunately, this presents a bit of a problem for the PA, which is a power-hungry, nonlinear device. Fortunately, there is a technique that is helping overcome these issues: Envelope Tracking (ET). ET offers improved battery life and RF PA performance along with reduced heat dissipation. However, the technique is not without challenges. Let’s take a closer look.
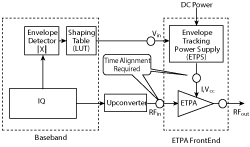
Figure 1 Block diagram of a typical ET system.
ET: The Basics
ET improves the power amplifier’s efficiency by tracking its bias voltage with the magnitude of the input signal envelope. ET dynamically adjusts the DC power supply voltage based on the envelope of the PA input signal, enabling the amplifier to be more linear, reach higher peak power, and achieve greater spectral and power-added-efficiency (PAE). It also reduces issues associated with distortion.
A block diagram of a typical ET system is shown in Figure 1. Here, the envelope detector measures the magnitude of the IQ waveform, which is fed to a shaping table to determine the bias voltage supplied to the PA. The shaped envelope signal is supplied to the envelope tracking power supply (ETPS), which modulates the bias voltage to track the RF input waveform. Finally, the PA amplifies the RF input signal.
ET does not apply a level limiter or operate with a fixed amplitude PA input signal, as is common with polar modulation. Instead, it may use a mixture of open and closed loop feedback, with delays introduced to the IQ or RF path to match those in the supply modulation path. In an open loop system, the shaping curve is applied to the envelope signal to match the supply voltage versus RF gain in the PA. Predistortion may also be used.
The Measurement Challenge
ET introduces an added complexity that makes configuring and testing an ET system especially challenging. Some of the specific challenges include:
PA Characterization for Simulation
ET requires additional testing, which drives up both test time and cost. A further complication, an ET PA must be treated as a 3-terminal active device. A low noise, high bandwidth power supply is also required, usually operating in a combination of switched and linear modes.
Shaping Table Design
The shaping curve or table determines the characteristics of the ET system. It must be properly designed and optimized to achieve the design goals, a process that is typically lengthy and difficult, often requiring many steps. Once designed, the shaping table and all the other components required to implement an ET system (i.e., ETPS, RF PA and radio design) must be tested or evaluated.
Antenna Tuning
While tuning the antenna is often performed by a specialist, the designer will likely need to check the operation of the ET system with antenna mismatch.
Time-Aligned Signal Generation
A timing misalignment of the envelope and RF signals of more than 1 ns will adversely impact the quality of the transmitted signal, affecting both adjacent channel power (ACP) and error vector magnitude (EVM). Timing misalignment results in an asymmetric adjacent channel leakage ratio (ACLR).
AM/AM and AM/PM Measurement
While an ACLR measurement will show a problem with the ET system, it won’t provide much insight into its cause. Linearity measurements of AM/AM and AM/PM, on the other hand, are key metrics for assessing ET performance. To improve linearity, supply modulation may be used. It reduces the in-band and out-of-band intermodulation signals at higher powers.
Instantaneous PAE
Measuring the improvement in system performance is a big challenge when implementing an ET system. The performance of the RF PA can be measured by itself, but it is a very difficult undertaking requiring measurement of the current with sufficient bandwidth. The supply current, voltage and RF power measurements need to be accurately time aligned to provide an instantaneous PAE measurement. An alternate and considerably easier approach is to measure the performance improvement as a combination of the ETPS and the ET PA, using a bench supply to measure average current.
Group Delay Through the ETPS
The ETPS has a lowpass filter response, making ripples in group delay through it especially worrisome. These ripples can cause excess distortion in the RF PA output.
Receive Band Noise Floor
In an ET system, all but the RF carrier decoupling capacitors are removed. Any spurious signals and noise on the power supply line to the RF PA appear at the output. Of particular concern is any increase in the transmitter noise floor that appears at the receiver duplex frequency in a frequency division duplexing (FDD) radio. This noise is coupled through the antenna duplexer and reduces the receiver’s sensitivity.
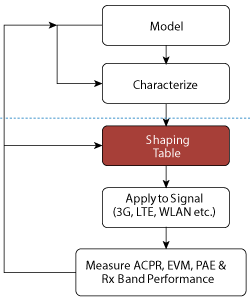
Figure 2 Possible ET system design and test flow.
In addition to these technical challenges, engineers must deal with the logistical challenge of determining which parts of the ET system to test and how to perform all of the modeling and measurement.
Confronting the Challenges
Dealing with the challenges to implement an ET system requires two essential components. The first is an ET design and test flow. One possible flow is illustrated in Figure 2. It begins with modeling the PA’s linear and nonlinear behavior and PA characterization. Next, the shaping table is designed. The envelope signal is then created, with the shaping table applied to the signal. Finally, the PA’s PAE, ACLR and receive band performance are measured and analyzed.
The second element to evaluate ET components and ET-based radio designs is a highly flexible and accurate ET test system. Such a system should be comprised of a simulation environment, signal generator and analyzer with signal generation and
analysis software, and an oscilloscope. For optimal flexibility, the system should support both LXI bench and PXI modular instruments and be based on common tools that enable effective teamwork, from R&D to design verification and into production.
A typical test system for the bench that can be used to perform the ET design and test flow is shown in Figure 3. For system modeling and simulation, electronic system level (ESL) design software is used to trade off the ET system’s baseband and RF performance. The software allows customized models to be developed and shared prior to simulation, so the performance and impact of different devices can be understood.
To generate both the RF and envelope signals required for evaluation and performance testing of the ET system, signal generation software with an ET option is employed. Once the envelope waveform is created, it is downloaded to a vector signal generator. An arbitrary waveform generator is used to generate the envelope waveform signal.
After downloading the waveforms, the timing of the RF and envelope signals is adjusted with the signal generation software. An oscilloscope measures the absolute time delay. The entire ET system performance (RF signal, envelope signal, ETPS and RF PA) is then evaluated using a signal analyzer and associated software.
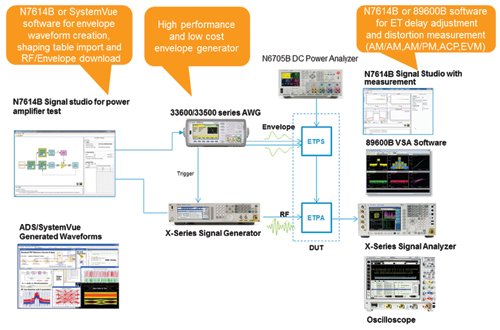
Figure 3 A typical test solution for ET PAs.
Based upon the results, the PA can be adjusted to improve its output signal quality, using ET alone or with other PA technologies like crest factor reduction (CFR) and digital pre-distortion (DPD). A general-purpose signal generator, signal analyzer and arbitrary waveform generator can help optimize PA performance.
PA characterization, including swept frequency and pulse power measurements, is performed using a network analyzer and DC power analyzer with source measurement unit (SMU). If the DC power analyzer with SMU has a dynamic capability, pulsed PA performance may also be characterized. During PA testing, RF power modulation is measured using USB RF power sensors. A peak power analyzer and wideband sensor analyze the modulated power.
For production test, the following equipment is needed: waveform generation software, vector signal generator, arbitrary waveform generator, SMUs, digital inputs outputs (DIO) for device under test (DUT) control DC measurements, and a vector signal analyzer with appropriate measurement application software.
Conclusion

ET offers a number of performance advantages. However, to fully achieve these, designers must first understand and overcome the measurement challenges with configuring and testing an ET system. An accurate and flexible hardware/software test system specifically targeted at ET combined with an ET design and test flow offer designers an ideal way to mitigate challenges that may arise.
Yu Qian (Kevin) is a wireless connectivity application expert and product marketing engineer with the Microwave Communications Division (MCD) at Keysight Technologies (formerly Agilent Technologies). Kevin has worked with Keysight for 13 years, with six years experience as an R&D software engineer and seven years experience as a marketing engineer and application expert. He is currently responsible for global wireless connectivity, new product introductions and business development. He also provides pre- and post-sale technical support and delivers training to internal field and application engineers and external customers. Kevin holds a master’s degree in electrical engineering from Beijing University of Posts and Telecommunications (2001) and a bachelor’s degree in electrical engineering from Shenyang Architecture University (1998).