
Today’s modern vector network analyzers (VNA) are the product of evolutionary advances in technology that literally span decades — a marrying of the latest developments in microwave, integrated circuit and software technologies. To a great extent, the precise nature of vector network analysis results from its highly developed calibration algorithms and methodologies. In many VNA applications, a flexible test port cable assembly or “test port extension” may be required. The test port extension is used to establish a through connection for calibration purposes and for making measurements of the device under test (DUT). Generally, a single port extension is used, but this is by no means the rule. Port extensions may be employed on Port 1, Port 2, or both VNA ports as well. Capable of very precise and accurate results, a VNA’s performance is predicated upon the stability and repeatability of the measurement system, that is, the DUT-to-VNA interface, which includes the test port extension, if used.
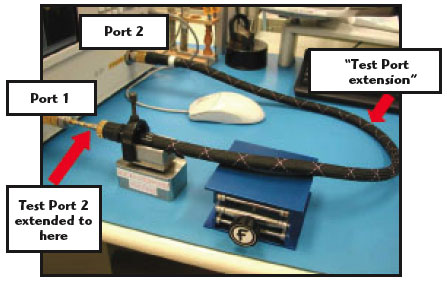
A test configuration using a flexible test port extension on Port 2 is illustrated in Figure 1. The resulting calibrated measurements of a given DUT will contain notable inconsistencies. When observing the analyzer display, S22 return loss will differ from S11 return loss, appearing somewhat “noisy” in nature. If the test port extension is flexed, changes in both S22 and S11 return loss data will be observed. If measuring a low loss DUT, the aforementioned behavior is exaggerated. The intent of this article is to offer a qualitative explanation for this behavior and its underlying mechanisms.
Understanding How a VNA Works: VNA Measurement Error Types
Directivity Error
A vector network analyzer utilizes directional couplers for measuring forward and reverse propagating signals. Directivity is a measure of a coupler’s ability to discriminate against a signal that is propagating against the “coupled direction.”

Reflection Response/Transmission Response Tracking Error
These errors represent the differences between reference signal paths and signal measurement paths.
Source Match Error
Error generated as a result of the mismatch between the source test port and the measurement system (this includes any device connected to the source test port).
Isolation Error
Error generated as a result of signal leakage between reference and measurement channels within the vector network analyzer.
Load Match Error
Error generated as a result of the mismatch between the load test port and the measurement system (this includes any device connected to the load test port).
Port 2 Match Error
Error generated as a result of the mismatch between the VNA test port and the test port extension.
The flow chart shown in Figure 2 is a popular format for describing both the desired signal flow and error signal flow associated with VNA measurements. Specifically, the diagram describes a “forward” S21 transmission measurement where the intended signal flow is left to right, from Port 1, through the DUT, and into Port 2. A representation of the flexible test port extension used in this study is highlighted in red. This error model represents the test configuration depicted in Figure 1.
The diagram can be applied to S11 return loss measurements as well. The various errors listed previously are corrected for during the calibration process. A mirror image of the diagram would apply to “reverse” S12 transmission data and S22 return loss data, port reference planes are highlighted in blue.
Summary of Findings
Through the calibration process, the VNA corrects for the phase and amplitude characteristics of the measurement system using a process known as “error correction.” A test port cable extension, if used, is considered part of the VNA measurement system. The error correction operation is static in nature. The correction algorithm “assumes” the test port extension’s phase and amplitude response remain constant. In short, the error correction algorithm is unable to compensate for future system changes.

The “noisy” quality noted primarily in, but not limited to, the DUT’s S22 return loss data stems from minute physical changes within the test port cable assembly — physical changes that occur during flexure. As a result, the measurement system has been altered from its original calibration state; the VNA’s error correction algorithms cannot compensate for this change.
These now-uncorrected changes are manifested as properties of the DUT, and are visible within the associated S-parameter data — most noticeably, in the return loss/VSWR data of the port equipped with the test port cable assembly. As the frequency increases, adverse effects resulting from changes in phase and amplitude response become more pronounced. This is especially true with phase, following the relationship
degrees = t (ns) • 360 • ƒ (GHz)
where a time period, t is expressed in degrees at a frequency, ƒ. This formula can be used to describe a particular cable assembly feature, with the feature in question having a time delay measured in nanoseconds, whose electrical length in degrees increases with respect to wavelength. As the frequency increases, the wavelength decreases. Although constant in its time delay, the feature size can cover multiple wavelengths or a fraction of a wavelength, depending upon the frequency of interest.
An unstable, flexible test port cable assembly will have a profoundly negative impact on a VNA’s measurement accuracy. By selecting a high quality cable assembly having long-term stability, coupled with proper measurement practices, one can significantly augment the capabilities of any VNA.
Description of Test Procedure and Equipment
The following equipment and procedures were used in this study. Data was captured using GORE proprietary software.
-
Agilent Technologies PNA, model E8364B, swept frequency range: 0.010 to 67 GHz
-
Flexible test port cable assembly, 2.4 mm socket to 2.4 mm ruggedized, NMD-style socket, GORE FE0BN0BL038.0, length: 38 inches
-
Calibration standard: Agilent Technologies E-CAL unit, 0.010 to 67 GHz, equipped with 1.85 mm interfaces
The ambient test conditions were 23° with relative humidity controlled at 20 percent. A full two-port calibration, omitting isolation, was applied over a frequency range of 0.0625 to 50 GHz, 800 points with an IF bandwidth of 100 Hz. No smoothing or averaging was used.
The low loss “insertable” DUT consists of an Anritsu 1.85 mm pin to 1.85 mm socket adapter, commonly known as a “connector-saver” (see Figure 3). This adapter is considered to be a stable and sufficiently precise device for the purposes of this study. After inserting the DUT and carefully tightening the interfaces to the proper torque specification, the test port cable assembly was examined to ensure it was routed in a wide arc with no undue stress placed upon it. Support fixtures were used to hold the DUT side of the test port cable assembly (see Figure 1). At this point, a base-line data set comprising all four S-parameters was recorded.
After recording base-line data, the test port cable assembly was bent sharply at a point just after the Port 2 connection. A data set consisting of all four S-parameters was collected with the cable assembly held in this bent or flexed position. Phase and amplitude characteristics of the DUT in the “flexed” and “not flexed” states were compared.
S-parameter Analysis
Although very slight, Figure 4 demonstrates the differences between S11 and S22 data when a test port assembly is used. In Figure 5, the test port assembly is flexed, as described in the test procedure. In this case, the differences are more prominent — S22 data differs noticeably from S11, especially in terms of trace smoothness. Observe that the “not flexed” S11 data differs from “flexed” S11 even though the distortion-inducing flexure occurred on the Port 2 side of the measurement system.
Figure 6 illustrates S22 return loss data for the low loss DUT using a test port extension in both the “flexed” and “not flexed” positions — note the behavior at and around nulls. Figure 7 is a detailed view concentrating on performance between 30 and 40 GHz. Differences are due to phase/ amplitude changes in test port assembly affecting error correction.

A more revealing representation for the change in return loss involves applying a subtraction operation to the “flexed” and “not-flexed” data sets, as seen in Figures 8 and 9. In this case, the change in S11, that is, a port not fitted with a port extension, is compared to the change in S22, a port fitted with a port extension. The assumption being that S11 will change little, if not at all during flexure.
Figures 8 and 9 are comparisons between “flexed” and “not flexed” states on Ports 1 and 2. To gain a better understanding of the magnitude of change on Port 1 compared to Port 2, refer to Figure 8. For an idea as to how changes in magnitude compare to key VNA calibration error criteria such as source match, load match, reflection tracking and directivity (all expressed in dB), refer to Figure 9.
As the change between the “flexed” vs. “not flexed” condition approaches –45 dB, anomalies appear in the S22 return loss data. This behavior can be verified by examining Figures 4 and 5. In general, desirable corrected error levels for source match, load match, reflection tracking and directivity are in the realm of –45 dB. Measurement system distortion approaching this level will have a detectable influence upon the S-parameter data of the DUT. Distortion levels less than –50 dB are generally beyond the system’s ability to distinguish such detail.
In Figures 6 and 7, a change in both S11 and S22 return loss is recorded. During calibration, the test port extension connected to Port 2 acts as the load match measurement path for Port 1. When the cable assembly is in the “flexed” state, any consequent distortion will affect the load match correction for Port 1. This explains the small change in S11 return loss even though the test port cable assembly was flexed very close to Port 2. If the DUT had possessed a significant amount of insertion loss, the change in S11 return loss between “flexed” vs. “not flexed” states would have been less pronounced. A high insertion loss DUT would isolate the two ports from one another, effectively reducing the influence of Port 2-related distortion on Port 1. Appendix A provides detailed explanations and examples of the basics of vector error correction.
Insertion Loss and Phase Analysis of Low Loss DUT
Figures 10 and 11 display the resulting apparent changes in insertion loss and insertion phase of the low loss DUT used in this experiment. The data clearly indicates a difference in phase and amplitude performance between the “not flexed” vs. “flexed” states of the test port cable assembly. To further emphasize an important point, these changes in phase and amplitude should not be confused with DUT performance; they are solely the result of changes within the measurement system that cannot be accounted for by the VNA error correction algorithm. As stated earlier, changes in the measurement system can easily be misinterpreted as changes in DUT performance.
Conclusion
The intent of this article was to explain the basic principles of VNA error correction and how VNA measurement system effects can be confused with DUT performance. This topic was deliberately approached in a qualitative manner so as not to burden the reader with the complexity of error correction algorithms. In closing, the following practices can be used to minimize the changes in phase/amplitude response associated with test port cable assemblies:
-

For measurements requiring a high degree of precision and accuracy, limit test port assembly movement during the calibration and measurement processes
-
Before using any cable assembly as a test port extension, measure its phase/amplitude response with flexure in two orthogonal planes of motion, noting which plane of motion yields the smallest change in phase/amplitude response. When attaching the assembly to a VNA, orient the cable so that its movement is in the plane of motion yielding the least amount of phase/amplitude distortion
-
To track performance degradation, periodically check the phase/amplitude stability of the flexible test port cable assembly by using the manufacturer’s advertised test method
-
Ensure that all VNA and DUT connections are clean and the specified connector tightening torque is observed. Inspect all DUT and test system connectors for damage; inspect all DUT and test system connectors for proper pin/socket height specifications before connecting to mating connectors
-
Perform VNA measurements in a temperature-controlled environment, ensuring instrumentation is positioned well away for heating/cooling ducts. Avoid placing instrumentation near exit/entrance ways, as these areas can experience intermittent fluctuations in temperature

Paul Pino
When considering the purchase of a test port cable assembly, carefully review and compare manufacturers’ claims of stability and repeatability with flexure. To realize optimal VNA performance, a high quality cable assembly with consistent long-term performance is required.
Acknowledgment
The author would like to thank Harmon Banning — mentor, teacher and friend — for his guidance in the preparation of this paper.
Paul Pino received his BS degree in electrical engineering from the University of Delaware in 2000 after leaving a long career in the automotive industry. He joined W.L. Gore & Associates Inc. in 1999 and has worked with various groups, including Gore’s Signal Integrity Lab, the Planar Cable Team and the Fiber Optic Transceiver Team. For the past four years he has worked within the ATE Microwave Group.
| APPENDIX A |
| SIMPLIFIED EXPLANATION FOR THE ILLUSTRATED BEHAVIOR IN FIGURES 4 THROUGH 7 |
 Condition is for stable calibration – ideal S22m = S22a + errtotal To arrive at corrected reading: S22a = S22m – errtotal |
|
The S22m vector represents a measured or uncorrected S22 data point. The S22a vector is an actual or corrected data point. When making a calibrated measurement, corrected data is displayed on the VNA screen. The errtotal vector is the sum of all error correction associated with a particular calibrated VNA measurement at a specific data point. In reality, the errtotal vector is comprised of several error correction vectors, including correction for the error associated with the calibration standards, as well as error associated with Port 2 of the VNA — hereafter referred to as errgeneral. In this example, a test port cable assembly connected to Port 2 is used as part of the calibrated measurement system. A portion of the error associated with Port 2 of the VNA is related to the test port cable assembly. |
 For this example, total error is: errtotal = errgeneral + errtest port cable |
Once the test port cable assembly is flexed (after a calibration is completed), the following occurs: |
 Grey vectors represent initial S22a and S22m results under ideal conditions Colored vectors represent S22a and S22m results with test port cable flexed |
|
Error correction vectors are fixed (in magnitude and phase) for a given calibration, therefore all measurements subsequent to calibration have correction applied that assumes the measurement system is static. With the test port cable assembly flexed, phase/amplitude distortion occurs. This distortion is manifested as a property of the DUT, not the test port cable assembly. The effect is S22m-new. The result: S22m has changed in magnitude and phase, thus S22a must change since it is calculated from S22m. The outcome — S22a-new — results from a calibration correction based upon having the test port cable in its original “calibration position” (shown in grey). |