
In this article, it is demonstrated that accurate antenna far-field predictions can be made from very-near-field measurements. The results obtained from near-to-far field algorithms, which are based on the plane wave spectrum approach, accurately correlate with full-wave simulated and anechoic chamber measured far-field results. By comparing the results between measurements obtained at a distance of 25 mm with those obtained at 80 mm, the advantages of measurements taken at extremely close distances are demonstrated. The far-field results predicted from the very-near-field measurements taken using a scanning instrument are compared with the results obtained from a conventional anechoic chamber. This research establishes that antenna measurements taken at very-near-field provide valid far-field results. Compared with traditional planar near-field methods, the very-near-field measurement technique has a wider angle of coverage and makes a small-area scanning plane possible, which reduces the size and cost of the instrument and also makes the measurement much faster.
The far-field radiation pattern is conventionally characterized by measuring the received amplitude and phase in a far-field region (where a perfect plane wave field is expected) by mechanically rotating the antenna under test (AUT) about the relevant coordinate. Usually, it is done in an anechoic chamber that is large and expensive and can take a long time due to mechanical constraints. An alternative to the far-field measurement is to measure the antenna in the near-field region. A near-field measurement system was first built in 1950 by Barrett and Barnes of the Air Force Cambridge Research Center.1 Most of the current near-field measurement instruments are based on the near-field measured in the radiating near-field region. This requirement means the size of the scanning surface and hence the overall systems can still be quite large, even though they are smaller than far-field systems. In this article, a description is made of a very-near field measurement technique that allows the scanning system to be compact and portable and allows measurements to be made in seconds without any mechanical movement of sensors.
Measuring antenna performance in the very-near-field had previously been avoided, due to the fact that the sensors can influence the performance of the AUT.2 Although not formally defined, the very-near-field is described here as being much closer to the sensors than traditional near-field measurements. Most of the measurements presented in this article were taken at a distance of 25 mm from the AUT. Depending on the frequency, this distance can even range into the reactive region which is mathematically defined as d < λ/2 π for small radiators.3 Although it is normally assumed that measurements cannot be done in the reactive region, there is nothing in the near field transformation that limits the distance to the measurement plane.3-7
The very-near-field measurements, described here, are taken so close that coupling between the AUT and the measurement probes cannot be avoided. An important part of the measurement process is minimizing this coupling effect and making it predictable. The approach chosen for this implementation was to have a static array of probes. The advantage of this approach is that for all measurement probe locations, the coupling is exactly the same. A secondary advantage of the array of probes used for these measurements is that there is no mechanical movement and therefore measurement of the very-near-field data can be done incredibly quickly. Even with this approach, there is no single solution to the coupling problem, since it is dependent on the AUT and the measurement probes, but a reasonable approximation of the effect can be made for unknown antennas.
The implementation of this approach is to measure the magnetic field (H-field) with the probe coupling effects and project this data to the far-field using the planar aperture distribution to angular spectrum transformation or plane wave spectrum (PWS) transformation.4,5 A second custom algorithm then adjusts the far-field projection to eliminate the predictable coupling effects of the measurement array. This leaves some small but unpredictable error that is dependent on the form of the AUT.
Validating the Very-near to Far-Field Algorithm
The first step is to verify that the implemented PWS transformation is accurate. This was done by generating ideal field values, which could be those generated in the very-near-field of an antenna, applying the PWS transformation to the ideal field values to get projected far-field results and comparing these far-field pattern shapes to theoretical results from the same ideal distributions.
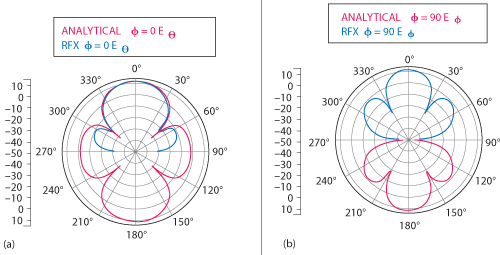
Figure 1 Comparison of theoretical and implemented very-near-field scanned radiation patterns evaluated at 2.5 GHz: (a) Φ = 0° plane and (b) Φ = 90° plane.
Y-Polarization with a Uniform Very-Near-Field
A uniform H-field distribution is used in this test. Field values are generated over an aperture of 16 × 24 cm with samples every 1 cm, creating a measurement array totaling 16 × 24. These values were chosen to match the implemented very-near-field measurement system that will be discussed later. Amplitudes for these measurements were set to 1 A/m uniformly and all phases are set to zero degrees for simulating the broadside radiating aperture. The polarization is in the Y-axis or along Phi = 90°. The near-field measurements were implanted into the code of the very-near-field measurement system and the predicted far-field radiation patterns at the two main planes (Phi = 0° and Phi = 90°) are compared with the theoretical results shown in Figure 1. For the pattern where Phi = 0° plane, the size of the scanner limits the accuracy to approximately ± 60° from 0°, while for the pattern where Phi = 90° shows an almost perfect match at all angles.
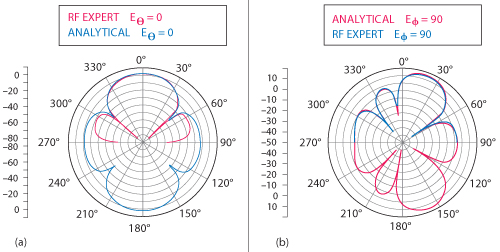
Figure 2 Comparison of theoretical and implemented very-near-field projected radiation pattern at 2.5 GHz: (a) Φ = 0° plane, and (b) Φ = 90° plane.
Y-Polarized Beam-Steered Very-Near-Field
The data is again a 2D array of 16 × 24, with the same size aperture described previously. The amplitudes are set to 1 A/m uniformly and phases are set to have a 10.8° progressive phase shift (in the Y direction) to obtain the 21° maximum radiation. The radiation patterns obtained from theoretical analysis and the implemented very-near-field instrument are compared in Figure 2.
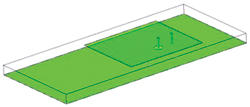
Figure 3 Diagram of the 1.8 GHz radiating patch antenna.
Again there is very good correlation between the theoretical and projected far field results. The same variation where Phi = 0° plane can be seen, where the size of the scanner limits the accuracy to approximately ±60° from 0°, while the results for Phi = 90° show a perfect match.
Comparison of 25 and 80 mm Measurements Projected to the Far-Field
In this section, the PWS transformation is applied to ideal very-near-field values that are generated from a simulated radiating structure. The chosen structure is a patch antenna at 1.8 GHz, radiating in free space. This antenna is shown in Figure 3. The radiating patch on the top is 44 × 36 mm and the maximum dimension of the ground plane backing the patch is 110 mm.
After a full-wave simulation, the H-field is sampled at a distance of 80 and 25 mm. In both cases, the sampling area is the same 16 × 24 array described earlier. The values generated at 25 mm are within the reactive region and those at 80 mm should be outside the reactive region. The simulated data is imported into the very-near-field measurement system’s software to predict the far-field radiation patterns and compared with the results from the full-wave simulation (see Figure 4).
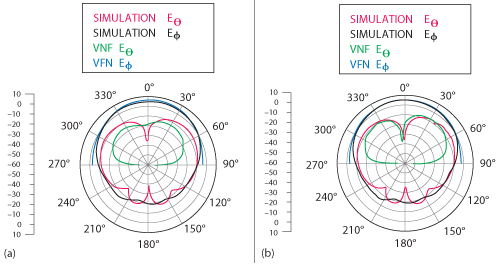
Figure 4 Far-field patterns projected from very-near-field scans (a) Φ = 0° plane, very near-field measured at 80 mm, (b) Φ = 0° plane, very-near-field measured at 25 mm.
Not only do the far-field results projected from the 25 mm very-near-field scan correlate well with simulated results, they are much closer to the simulated results than the 80 mm scan. This result is due to the fact that the 25 mm scan has a wider angle of coverage than the same size scan area at 80 mm. As a result, the 25 mm scan can produce excellent pattern accuracy, with a very small scan area. The directivity projected from the 25 mm very-near-field scan is 6.0 dBi, which compares very closely to the simulated directivity of 5.7 dBi. The 80 mm scan projected a directivity of 7.8 dBi.
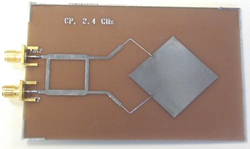
Figure 5 The circularly-polarized patch antenna.
Comparison of Patch Antenna Measurements: Simulated, Very-Near-Field and Chamber Results
The patterns shown in the previous two sections were produced with ideal very-near-field data generated through full-wave simulations. In this section, the results are produced from a fully implemented very-near-field measurement system. The array of probes is present for the measurement of the field values. The probes are linearly polarized loops that are arranged in two polarizations on the planar surface.
The antenna chosen for testing in this section is a circularly polarized patch shown in Figure 5. The patch antenna was set up to be right hand polarized for the tests. The results show that linearly polarized very-near-field measurements can be used to measure the performance of a circularly polarized antenna. The very-near-field measurement system is able to indicate rotation direction (right-handed or left-handed), plot both right-handed and left-handed circular polarization patterns and provide the axial ratio at all angles.
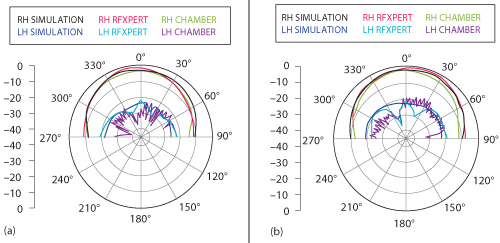
Figure 6 Simulated and measured radiation patterns for the circularly polarized patch antenna (a) Φ = 0° plane and (b) Φ = 90° plane.
The results, shown in Figure 6, show good correlation both for the right hand pattern and for the left hand pattern. The patterns generated by the implemented very-near-field system are labeled RFxpert. For the low level left hand patterns, two measured results detect a small null that appears around 340°, while the simulation results miss this.
Commercial Results Comparing Very-Near-Field Scans with Chamber Measurements
The results presented thus far have all related to far-field patterns. In addition to patterns, very-near-field measurements can also generate absolute values for other parameters such as total radiated power (TRP). This is demonstrated in Figures 7 and 8.
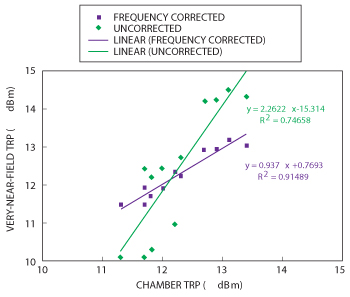
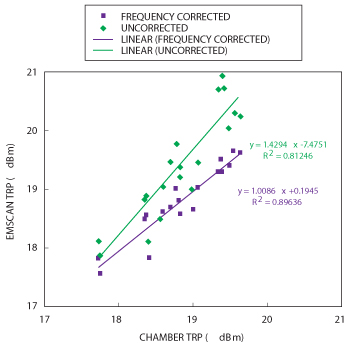
Figure 8 Comparison of chamber results (green) with very-near-field results from a very-near-field scanning system at WCDMA bands 5 and 6 frequencies.
The results shown are a collection of data from a very-near-field measurement system in a commercial environment. This system was used to measure a batch of same model mobile devices. The two sets of results shown here are with the generic compensation for coupling effects. This is the one that has no knowledge of the AUT and is labeled ‘Uncorrected’ here. The second set of results has been corrected for variations that are device-specific and can only be determined after some measurements have been collected.
These results confirm that measurements, made in the very-near-field, can be used to predict TRP when corrected for predictable coupling effects. Over this large data set, the difference is less than ±1.5 dB. The results also show that improvements to the generic coupling compensation can be made with knowledge of a device-specific coupling factor. With this added compensation, a very strong positive correlation can be seen.
Conclusion
Measurements, obtained by scanning antennas in the very-near-field and using this data to generate far-field projections, demonstrate close correlations with patterns and direct measurement parameters obtained in anechoic chambers. It was confirmed that the implementation of the algorithm is accurate and then that very-near-field scans at 25 mm can give accurate far field projections, even if the measurement points lie in the reactive region. A second advantage of the very-near-field measurement system was demonstrated to be good pattern accuracy with a very small scan area. Far-field radiation patterns predicted from actual very-near-field measurements were compared with results measured in an anechoic chamber and results generated by full-wave simulations for a circularly polarized (RH) patch antenna. The comparison confirmed the close correlation between chamber results and those obtained from the implemented very-near-field scanning system. In this case, compensation was only made for the predictable coupling effects, which demonstrate that accurate patterns can be measured with no knowledge of the AUT. It was also demonstrated that very-near-field measurements could also accurately obtain direct measurement results for other antenna parameters, such as total radiated power and radiation efficiency.
References
- R.M. Barrett and M.H. Barnes, “Automatic Antenna Wavefront Plotter,” Electronics, Vol. 25, January 1952, pp. 120-125.
- A.D. Yaghjian, “An Overview of Near-field Antenna Measurements,” IEEE Transactions on Antennas and Propagation, Vol. 34, No. 1, January 1986, pp. 30-45.
- C.A. Balanis, Antenna Theory: Analysis and Design3rd Edition, John Wiley & Sons, Somerset, NJ, 2005.
- H.G. Booker and P.C. Clemmow, “The Concept of an Angular Spectrum of Plane Waves, and its Relations to that of Polar Diagram and Aperture Distribution,” Proceedings of the Institute of Electrical Engineering, Part III, Vol. 97, January 1950, pp. 11-17.
- P.C. Clemmow, The Plane Wave Spectrum Representation of Electromagnetic Fields, Pergamon Press, London, 1966.
- D. Slater, Near-Field Antenna Measurements, Artech House, Norwood, MA, 1991.
- S. Gregson, J. McCormick and C. Parini, Principles of Planar Near-field Measurements, Institution of Engineering and Technology, Electromagnetic Waves Series, London, UK, 2008.