
Spectro VNA™ vector network analyzer software brings the power of joint time-frequency domain processing to vector network analyzers (VNA). Many microwave engineers are familiar with joint time-frequency domain processing from spectrogram displays on vector signal analyzers. Spectrograms display the magnitude of a signal as a function of both time and frequency simultaneously. Figure 1 shows a spectrogram of an 802.11g waveform.
Visualization of S-Parameters
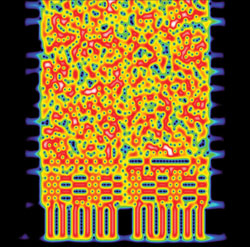
Figure 1 Spectrogram of an 802.11g signal created with Spectro VSA™.
Introducing this technology to the VNA world enhances the visualization of S-parameters and increases the processing capabilities of VNAs. For VNAs, the data being visualized is not a signal, but a transfer function of a device. Traditional VNA views of Sparameters in the frequency domain show magnitude versus frequency. Time domain processing shows magnitude versus time. A joint time-frequency domain plot shows the frequency dependent behavior of individual responses.
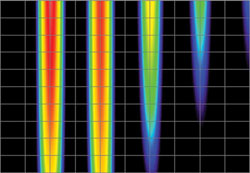
Figure 2 shows a spectrogram for the S11 of a device. The horizontal scale is time; the vertical scale is frequency. The color represents the magnitude of S11 at a particular moment in time and at a particular frequency. The vertical stripe at 2 nsec shows a variation in color from lower frequency to higher frequency, indicating that the reflection is greater at higher frequencies. This is one of the principal values of joint time-frequency processing as applied to VNAs, namely, the ability to see the frequency response of a part of the device.
S-Parameter Workspace
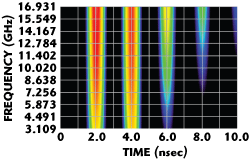
Figure 2 Spectrogram of S11 produced with Spectro VNA™.
While the visualization of a S-parameter in this way is valuable, a spectrogram is not merely a static image. It is a workspace that can be used to explore the characteristics of a device as both a function of frequency and time. The mathematics of joint time-frequency processing is not impaired by the problems associated with frequency gated by time mathematics typically found in VNA time domain processing. Individual points in the time-frequency space can be examined simply by clicking on the spectrogram. Individual slices can be taken across the frequency domain or time domain. Specific responses can be mathematically isolated and reconstructed using a tool that selects regions of the time-frequency space.
Time Domain Substitution
In addition to generating powerful images, the mathematics of joint time-frequency domain processing enables simplified de-embedding. Time Domain Substitution is a technique for simplified de-embedding using a single standard. That standard can be a short or an open, depending on which standard is easiest to fabricate in the desired environment.
De-embedding with Time Domain Substitution is accomplished by making two measurements of each port. One measurement is performed on the device and the second is performed on a temporarily placed standard. Typically, it will be convenient to create a temporary short circuit near the device, as high quality short circuits are relatively easy to create. Once the two measurements have been obtained, Spectro VNA processes the results to remove undesirable effects, such as connectors and launches.
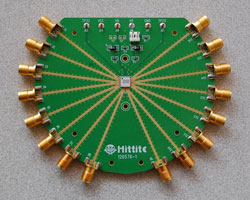
Figure 3 PC board with SMA launches, lossy transmission lines and a device to be measured.
As an example, consider the PC board shown in Figure 3. When measuring the input match of a pin of the device, the SMA launch corrupts the measurement. Using Time Domain Substitution, the effects of the launch and the loss of the transmission line between the launch and the device can be removed, leaving just the input match of the chip. Figure 4 shows the measured S11 data measured at the SMA input to one pin of the device, and the de-embedded value of S11 for the chip. The de-embedded trace (b) has the ripple associated with the interaction of the device and the SMA launch removed, as well as the line loss from the transmission line. Extracting the device response from a measurement of a PC board with a mounted device is quick and easy using Time Domain Substitution. For this example, the measurements were all performed with the device soldered to the board; no socket was needed for additional calibration standards.
Although the example shown here is for one port de-embedding, Time Domain Substitution can be used to de-embed two port measurements. It can also be applied to n-port devices. A particular advantage for multi-port devices is that Time Domain Substitution does not require port-to-port standards to be able to de-embed multi-port measurements.

Figure 4 |S11| as measured (a), and de-embedded (b) using time domain substitution.
Applications
Spectro VNA is useful when debugging device or measurement issues as it shows S-parameter values simultaneously in time and frequency. The de-embedding method, called Time Domain Substitution, is helpful for removing the effects of PC boards or other circuit elements that lie between the calibration reference plane of a VNA and the DUT.
Availability
Spectro VNA is available as a purchase or subscription on a monthly basis. Using the subscription model, users only pay for the software when they need it. They can discontinue use for an arbitrary period of time and then resume later when the need arises. Spectro VNA can retrieve data directly from many brands and models of VNAs. The data can also be input from files using the S1P, S2P, S3P and S4P formats. It runs under Windows XP, Vista, or 7. No additional hardware or software is required.
Constant Wave
Colorado Springs, CO
(719) 331-2442
www.constantwave.com