Almost all electrical elements and components have more or less nonlinear characteristics: they generate harmonics, mixture and intermodulation (IM) products. In order to prevent these effects from affecting the performance or even damaging the system functionality, a nonlinear characterization is necessary to obtain high end results. In this context, nonlinear microwave design is introduced for power amplifier optimization.1
The large-signal network analyzer (LSNA)2 was the first system providing nonlinear vector harmonic measurements. The LSNA uses broadband detectors3 or broadband samplers4 and supports only two-port measurements. In addition to the LSNA, a modified architecture for one-port measurements has been described.5 This modified architecture, using a commercial VNA, external software, additional comb generators and the power head for the calibration, enables nonlinear two-port measurements.6
Among the above-mentioned advantages, the vector IM-measurement provides additional benefits, such as better modeling and IM-source detection. A first verification of the nonlinear vector intermodulation reflection measurement by detecting the location of the IM-source was presented.7 A passive intermodulation analyzer (PIA)8 to measure scalar passive IM (PIM), such as in cables, connectors, etc., is already available, providing scalar results, similar to those from a spectrum analyzer.
The novel vector multi-port nonlinear system (NonLin-IM)9 allows users to determine the magnitude and phase of the frequency converting scattering parameters of narrowband IM-measurements with high precision and high dynamic range, using a phase reference generator. The phase information allows a better modeling of the measured devices and the detection of one dominant IM-source.

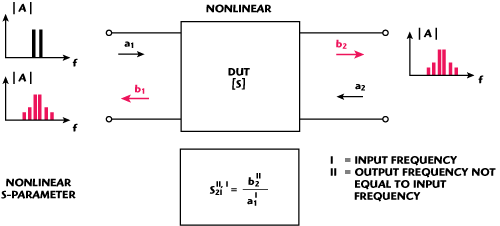
Figure 1 Frequency converting scattering parameter S21II,I for intermodulation applications.
Figure 1 shows the basics of the nonlinear scattering parameters for IM-measurements. The incident wave a1 consists of the two frequencies fI and fII; the transmitted wave b2 and the reflected wave b1 include further component frequencies, arising from intermodulation, harmonic, or mixture products. The nonlinear scattering parameters describe precisely the relation between input and intermodulation frequencies. The figure explains the nonlinear transmission parameter S21 for a relation of the transmitted wave b2II (at the frequency fII) to the incident wave a1I (at the fundamental frequency fI).

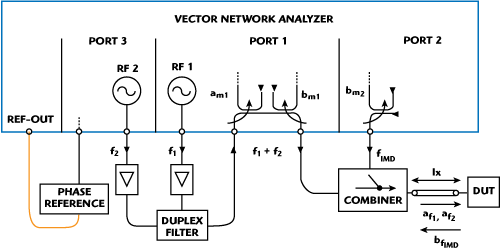
Figure 2 Block diagram of the full measurement set-up for intermodulation transmission measurements.

Figure 3 Block diagram of the full measurement set-up for intermodulation reflection measurements.
Architecture and Nomenclature for Intermodulation Measurement
The IM-products of some measured nonlinear devices, such as amplifiers, are stronger at the output compared to the input. Due to the different behavior of these devices at the input and output, it is necessarily to measure the reflection at the input and the transmission at the output. This system allows both measurements with a vector network analyzer (VNA) and additional equipment. The block diagram of the measurement setup for intermodulation transmission measurements with a three-port VNA is shown in Figure 2. Figure 3 shows the measurement setup for intermodulation reflection measurements with a three-port VNA.

Figure 4 Block diagram of the full measurement set-up for intermodulation reflection measurements with a four-port VNA.

Figure 5 Block diagram of the full measurement set-up for IM measurements at the RX port with a four-port VNA (eg. ENA).
For VNAs without open test-set, the system also provides measurement setups with a four-port VNA, as shown in Figure 4. VNAs with only one RF source are also supported. Figure 5 shows a test-set to control IM-products at the RX-path of duplex-filters or switches in RF front-ends with a high TX-signal and a medium antenna signal. The VNA-setup includes a synthesizer to provide the phase reference, which is driven by a 10 MHz crystal oscillator (XCO). The two amplifiers are used to increase the power of the signals at the input of the device and so the associated dynamic range. In order to prevent the measurement from being affected by the self-intermodulation of the VNA, a duplex filter is needed. An additional Wilkinson-coupler is used to measure the IM-reflection at the input of the device and to isolate the measuring ports.

Figure 6 Photograph of the extended VNA set-up.
Figure 6 shows the photograph of the implemented six-port vector network analyzer. This expanded VNA is based on a Rohde & Schwarz ZVT 20 six-port VNA. The nonlinear IM-measurement requires five channels of the ZVT. The calibration of the VNA with combiner, as shown in Figure 6, was performed using the without-thru calibration procedure.10 This patented procedure is the only known multi-port calibration method available for frequency converting measurements using one-port standards, since all eight error correction data (for two-port measurements) are absolutely provided in magnitude and phase.

Figure 7 Novel phase reference generator with very low phase noise and small step size.
The output of the phase reference generator is connected to the fifth channel of the VNA. It serves as a phase reference to measure the absolute phase of the measured waves. The VNA internal LO and the internal RF synthesizers have an unknown random phase offset, compared with the XCO. Linear measurements are based on the ratio between the reflected or transmitted wave and incident wave at the same frequency, so the unknown phase offset is eliminated. However, this is not the case for frequency converting measurements, where the measured waves, such as a1m and b2m, are not at the same frequency. The use of the phase reference generator, shown in Figure 7 (SG 1624 for 1.6 to 2.4 GHz), eliminates this unknown phase error, because the signal at the output of the phase reference generator is in phase with the XCO.
For a description of the different frequency conversions, the following nomenclature was fixed:
- S21IM3L,f1 (Transmission parameter of the frequency conversion from f1 to the lower IM3-product)
- S11IM3L,f1 (Reflection parameter of the frequency conversion from f1 to the lower IM3-product)
- S21IM3U,f1 (Transmission parameter of the frequency conversion from f1 to the upper IM3-product)
- S11IM3U,f1 (Reflection parameter of the frequency conversion from f1 to the upper IM3-product)
The system can also measure higher order IM-products, such as S21IM5L,f1, S11IM5L,f1, S21IM5U,f1, S11IM5U,f1, etc.
Measurement Results and Verification
For the verification of the intermodulation measurement with the novel phase reference generator, the technique described previously by the authors7 was used. With the phase information, it is possible to detect the distance to the nonlinear device by using the intermodulation reflection measurement. As a nonlinear device under test, an amplifier with cable at the input was used, as shown in Figure 8.

Figure 8 Magnitude of the transmission from the 1st fundamental frequency to the lower 3rd order IM product (S11IM3L,f1) of an amplifier.

Figure 9 Phase of the transmission from the 1st fundamental frequency to the lower 3rd order IM produce (S11IM3L,f1) of an amplifier.

Figure 10 The real phase of a 30 cm cable and the corresponding display on a VNA.
The dynamic range of the system used (VNA without additional amplifiers) is approximately 80 dBc. For the first measurement, the DUT (amplifier) was directly connected to the calibrated port (output of the Wilkinson-combiner). Figure 9 shows the measurement results for the phase of the nonlinear S-parameter S11IM3L,f1. In this figure, the bottom axis represents the first fundamental frequency and the top axis the intermodulation of the third order resulting from the basic frequencies f1 and f2 (fIM3L = 2f1 - f2). This was a very small band measurement of 20 MHz. The fundamental frequency f1 was stepped from 890 to 910 MHz. The second fundamental frequency f2 was set to f1 + 50 MHz to correspond with the duplex-filter. The lower intermodulation products of the third order were arising from 840 to 860 MHz. The amplifier has a frequency converting reflection S11IM3L,f1 of approximately -28 dB, so the intermodulation products are well detectable. The phase of S11IM3L,f1 makes a phase change of 110°. For the detection of the location of the IM distortion, the gradient and the equation described by the authors was previously used.7 Figure 10 shows the visible and the real phase of a 30 cm cable. As can be seen, the visible phase is just between ±180°. The knowledge of the real phase is necessary to calculate the correct length of the cable at the input of the device. To get the correct phase the gradient of the phase is used.
To detect the length of the cable, the equation lx = φ(f)/β(f) has to be modified for the three frequencies to:


Figure 11 Phase of the transmission from the 1st fundamental frequency to the lower IMP3 of an amplifier with a 1.23 m cable at the input.
Figure 11 shows the phase response of the amplifier with 1.23 m cable at the input.
After subtracting the phase of the device, the phase obtained with Equation 1 and 2

the detected electrical length of the cable is 1.24 m, while its physical length is 1.23 m. This result proves the high phase accuracy of the phase reference generator and the system.
Conclusion
This article describes a multi-port measurement system to determine nonlinear intermodulation distortion with an extended VNA and a novel phase reference generator. This system allows users to determine the magnitude and phase of nonlinear scattering parameters for narrowband intermodulation measurements with small step size and high precision. Additionally, a number of test-sets for the various intermodulation measurements are also supported. Measurements of IM-distortion caused by an amplifier and the detection of the length of the cable connected to the device are presented, providing a first evaluation of the system performance. The technique shown provides an excellent foundation for accurate modeling of RF components.
References
- D. Vye, “Fundamentally Changing Nonlinear Microwave Design,” Microwave Journal, Vol. 53, No. 3, March 2010, pp. 22-44.
- J. Verspecht, F. Verbeyst and M. Vanden Bossche, “Network Analysis Beyond S-parameters: Characterizing and Modeling Component Behaviour under Modulated Large-Signal Operating Conditions,” 56th ARFTG Conference Proceedings, December 2000.
- H.C. Luong and G.C.T. Leung, “Measurement of Magnitude and Phase of Harmonics Generated in Nonlinear Microwave Two-ports,” IEEE Transactions on Microwave Theory and Techniques, Vol. 37, No. 10, October 1989, pp. 1506-1511.
- T. Van den Broeck and J. Verspecht, “Calibrated Vectorial Nonlinear Network Analyzers,” 1994 IEEE MTT-S International Microwave Symposium Digest, pp. 1069-1072.
- P. Blockley, J.B. Scott and A.E. Parker, “A New Instrument Architecture for Millimeter-wave Time-domain Signal Analysis,” Proceedings of the 63rd ARFTG Conference, Fort Worth, TX, June 2004, pp. 47-51.
- P. Blockley, D. Gunyan and J.B. Scott, “Mixer-based, Vector-corrected, Vector Signal/Network Analyzer Offering 300 kHz to 20 GHz Bandwidth and Traceable Phase Response,” 2005 IEEE MTT-S International Microwave Symposium Digest.
- K. Thalayasingam and H. Heuermann, “Novel Vector Nonlinear Measurement System for Intermodulation Measurements,” 2009 European Microwave Conference Digest, pp. 926-929.
- Rosenberger Hochfrequenztechnik, http://www.rosenberger.de/en/Products/18_Communication_PIM.php.
- Heuermann HF-Technik, http://hhft.de/index.php?page=products&subpage=network_analysis_p1a.
- H. Heuermann, “Calibration of a Network Analyzer without a Thru Connection for Nonlinear and Multi-port Measurements,” IEEE Transactions on Microwave Theory and Techniques, Vol. 56, No. 11, November 2008, pp. 2505-2510.

Kokulathasan Thalayasingam received his Dipl.-Ing. degree from the Aachen University of Applied Sciences, Germany, in 2008. Since then, he has been with Heuermann HF-Technik GmbH, Germany, where he is leading the department of network analysis. He is developing a novel nonlinear measurement system (NonLin-S and NonLin-IM) for frequency converting scattering parameters. His field of interest includes high frequency measurement techniques and software development.

Holger Heuermann received his PhD degree in electrical engineering from the University of Bochum, Germany, in 1995. From 1995 to 1998, he worked at Rosenberger Hochfrequenztechnik, Germany, where he was engaged in the design of RF equipment for measurements with network analyzers. In 1998, he joined Infineon Technologies, Munich, Germany, leading a development group for wireless front-end modules. Since 2002, he has been with the University of Applied Sciences, Aachen, Germany, where he is currently a professor, leading the department of RF technology. Since 2008, he is leading the company Heuermann HF-Technik. His current research interests include the design of RF transceiver circuits, RF plasmas as well as high precision scattering parameter measurements.
