Electronic Support Measures (ESM) receivers geo-locate threat emitters by measurement of angle of arrival (AOA), time difference of arrival (TDOA) or frequency difference of arrival (FDOA). Errors in the measurement of phase and frequency may be contaminated, due to spurious responses that yield irresolvable errors.
Phase Contamination
Radar signals in a receiver generate single-tone spurious response due to frequency conversion in mixers. Consider a unit amplitude signal and a single-tone generated spurious response as given below:

where f is the IF frequency of the signal, r is the ratio of spur level with respect to the true signal level that is less than unity, Δf is the spur frequency off-set from the signal frequency and θ is an arbitrary phase angle. Using trigonometric identities, Equation 1 may be reduced as shown below:

Equation 3 can be expanded as an infinite sine series for the case where r2 is less than 1.1

Note that the spur signal contaminates the signal by appearing to cause amplitude modulation and frequency modulation on the signal.
For k=1 and (2πΔf+θ)=π/2, Equation 4 becomes:

For k=1 and (2πΔf+θ)=3π/2, Equation 5 becomes:

The peak to peak angle variation in degrees is:

For the case where r is less than or equal to 0.1, Equation 7 reduces to:


Figure 1 Peak phase error due to spurious response.
Figure 1 shows the peak phase error due to spurs of various levels. Spur levels greater than -29 dB may cause phase errors of 4° or greater.
Frequency Contamination
The instantaneous frequency is the time derivative of the instantaneous phase.

For k=1 and (2πΔft+θ)=πN, where N is an integer, Equation 1 becomes:


For k=1 and (2πΔft+θ)=πN, where N is an integer, Equation 9 becomes:


The peak to peak frequecy deviation is given below:


Spurious Responses
The two parameters that determine the degree of frequency contamination are the frequency difference between the true IF signal and the spur frequency. The order of the spurious response is defined by the notation MRF × NLO, where M and N represent the harmonic of the RF and LO signals, respectively. The frequency difference is considered for the case where the LO signal is greater than the RF signal.

For the case where M equals two and N equals one:


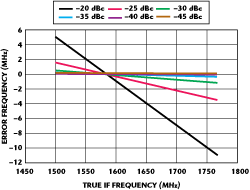
Figure 2 Frequency contamination due to 2RFxLO spurs.
Table 1 lists the true IF frequencies, the difference between the true IF and the spurs frequencies for the case of a 2RF × 1LO spur frequency conversion. Figure 2 shows the frequency contamination for the 2RF × 1LO spurs for various spur amplitudes. The predicted spur analysis is shown in Appendix A. This shows that the frequency error due to a -20 dBc spur may vary from approximately 5 to -11 MHz.

Crossing Spurs
Spurious responses of a received signal may create spurious signals that cross the true IF signal. These are called "crossing spurs" and may cause phase measurement errors, depending on the spur level. The following equations allow a determination if a spur of an RF signal will generate a crossing spur for a selected LO signal frequency. At some point in an RF band, the crossing spur frequency will equal the true IF signal frequency.
Case I: The LO signal frequency is above the RF signal frequency and the IF is the difference frequency.
The true IF signal is:

The MRF × NLO spur frequency, for positive frequencies, is:

The difference frequency between the spur signal and the true IF signal is:

For a given LO signal, the RF signal at which the spur frequency equals the true frequency:


Figure 3 Spurious response due to input RF signals.

Figure 4 Spurious response appearing in the IF output.
It can be shown that the same result is obtained for the case where the RF signal frequency is above the LO signal frequency and the IF is the difference frequency. Appendix A lists the predicted spurious responses for a special purpose receiver. Figures 3 and 4 show the predicted spurious response due to input RF signals and the spurs that appear in the IF output. The maximum predicted IF level spur is -49 dBc and causes a phase error of 0.06°. The frequency due to the -49 dBc for the data in Table 1 varies from 3.73 to -1.99 MHz.
Conclusion
Spurious responses generated in ESM receivers greater than -25 dBc may cause significant frequency and phase measurement errors, affecting the geo-location accuracy of threat emitters. n
Reference
- L.B.W. Jolley, Summation of Series, Dover Publications Inc., New York, NY, p. 100, Equation 536; p. 102, Equation 540.
Samuel J. Caprio is a consultant with over 30 years experience in ESM receiver systems design and six years experience in the design of transmitter systems. He was the receiver system engineer for the EA-6B ADVACP system, the ESM receiver system for the A-12 Navy Stealth aircraft, the AIEWS shipboard system and the ICAP-III ESM receiver system while employed at Litton. He designed the receiver and transmitter systems for two DRFM-based decoy systems for NRL while employed by CACI.
