

In this day and age manufacturers are trying to drive costs out of every aspect of the production flow, and RF and microwave is no exception. That means that every process step gets closely scrutinized. Specifically,“test” is one of the operations constantly under evaluation to understand the bare minimum needed to verify performance. That approach is understandable because test is likely one of the most time consuming steps in the production flow, particularly when you include system set up time.
While efficiency is a great goal, it is vital to maintain the proper balance between obtaining the minimum test data required for verification and capturing enough data to efficiently diagnose production failures when they occur.
Ten years ago,engineers assigned to keep the product flowing were at a major disadvantage when it came to understanding production failures. The reason is because only “Pass/Fail” results,along with the associated worst offending data points, were logged. If the production engineers wanted to understand the failures, it was their responsibility to get access to the critical test equipment (typically the production test station) and replicate the failure in real time. Often times, test engineerswould get pulled in to solve the problem as well. The production and test engineers would then work together to set up the test system in the correct configuration and cross their fingers that the failure could be duplicated for the device under test (DUT) or potentially multiple DUTs. Once the data had been collected,they still had the task of troubleshooting and dispositioning the units for repair.
The above test process was very inefficient and involved a significant amount of waste. First, engineers had toreplicate the failure rather than just pull test data from a database. Next, they needed access to production test to replicate the failure, possibly delaying production and revenue. In addition, the process requiredsignificant engineering resources to set up the test system. Finally, the time spentreplicating the failure onmultiple DUTs was a waste in itself. Overall, the processwas an expensive series of activities. Fortunately, that waste can now be avoided by putting test data in an easy to access repository coupled with analysis tools.
A major change over the past decade has been the rapid decrease in the cost of memory.Given the cost of production failure compared to the minimal cost of storage, there is no reason not to store every piece of data you collect. Heck, if the effort is minimal and the test times are not impacted significantly, you may also want to add a few more tests that could offer critical insights down the road.
My advice at this point is to not be “penny wise and pound foolish.”Since RF/µWave testing is done over a larger range of frequencies, you’re doing yourself a huge disservice if you only save the max or min points. You are better off capturing every data point for each test because every failure will have a signature, and otherwise you are giving up critical diagnostic information.
Now that you are ready to save as much data as possible, the next hurdle is creating a tool for pulling and analyzing the data. For starters, the tool should have a user friendly interface that allows the data to be pulled directly from the repository. To eliminate further waste, the tool should generate plots internally rather than require an export step.
A further requirement is that the tool has appropriate filters for comparing test data. When diagnosing a failure there is a basic binning process for determining the type of failure:
- Is the failure unique to this one unit, or is it batch related?
- Is it a gross failure, or is it barely failing the limit?
- Does the performance maintain the same signature or does it change with time or temperature?
To understand if the failure is unique or batch related, it’s important to group the tests for a given set of DUTs and overlay the plots. Unique failures are typically some sort of assembly error, such as a misplaced part, a defective part or a defective interconnect. Batch failures could be a number of things such as a new lot of parts, poor part placement by an automated piece of assembly equipment, or a manufacturing error by a new assembler.
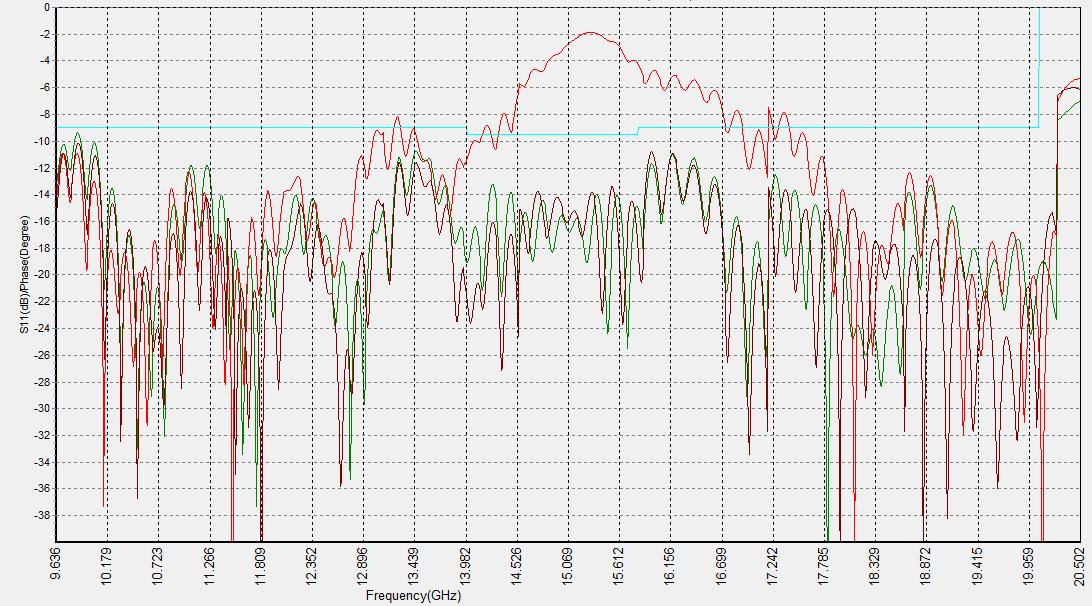
Unique Failure (Failure due to assembly error)
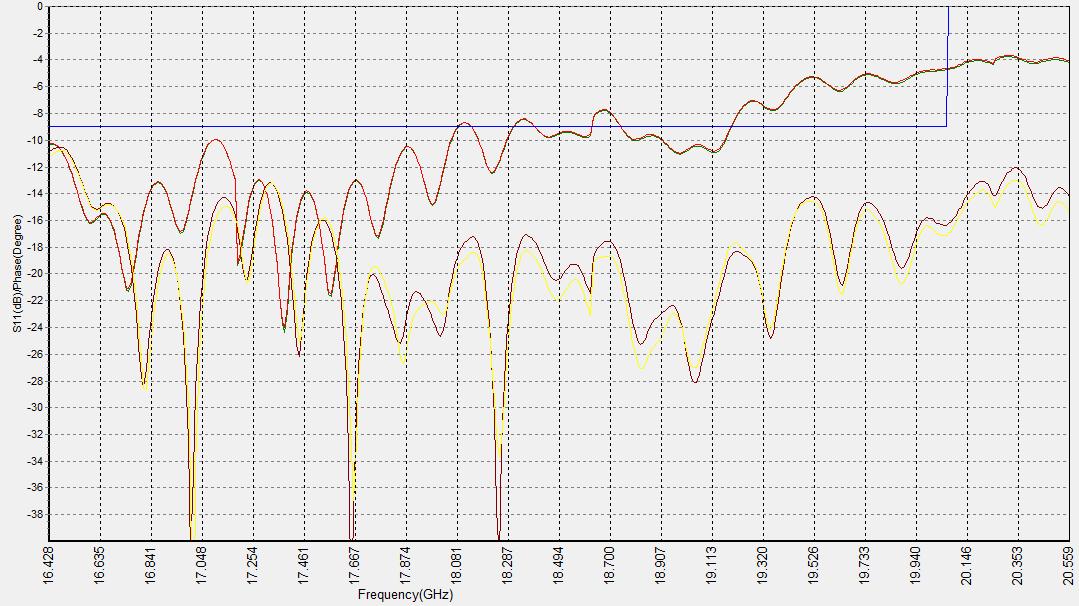
Lot Failure (Separation in two groups due to difference in board vendors)
Next, determine if the failure is a gross failure or just a marginal one. This is again accomplished by reviewing the plots to gather an understanding of the fail mode. Gross failures are usually easier to identify than minor failures since they can typically be found with a visual inspection (VI) and are normally the result of a misplaced, missing or defective part. The marginal failures are the hard ones, often requiring the ability to zoom in on a particular region. In higher frequency ranges (> GHz), the shape and placement of the parts can cause a part to fail by a very small margin. In such cases, I recommend the use of automated assembly equipment usingan automated pick and place for the component attach or an automated bonder for the interconnects.
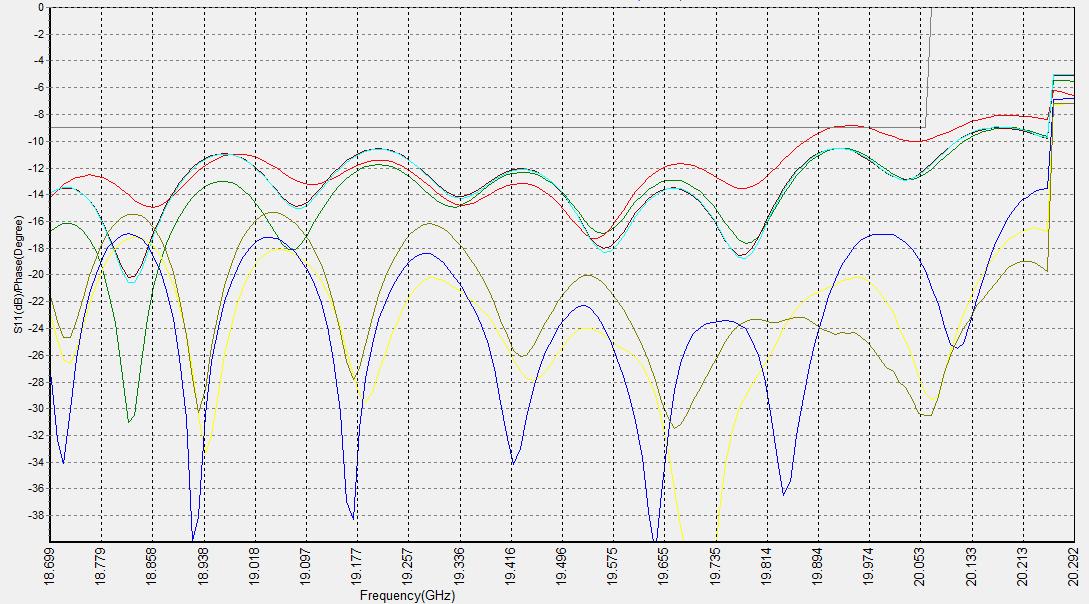
Margin Failures (Failure corrected with minor change to shape of wire interconnect)
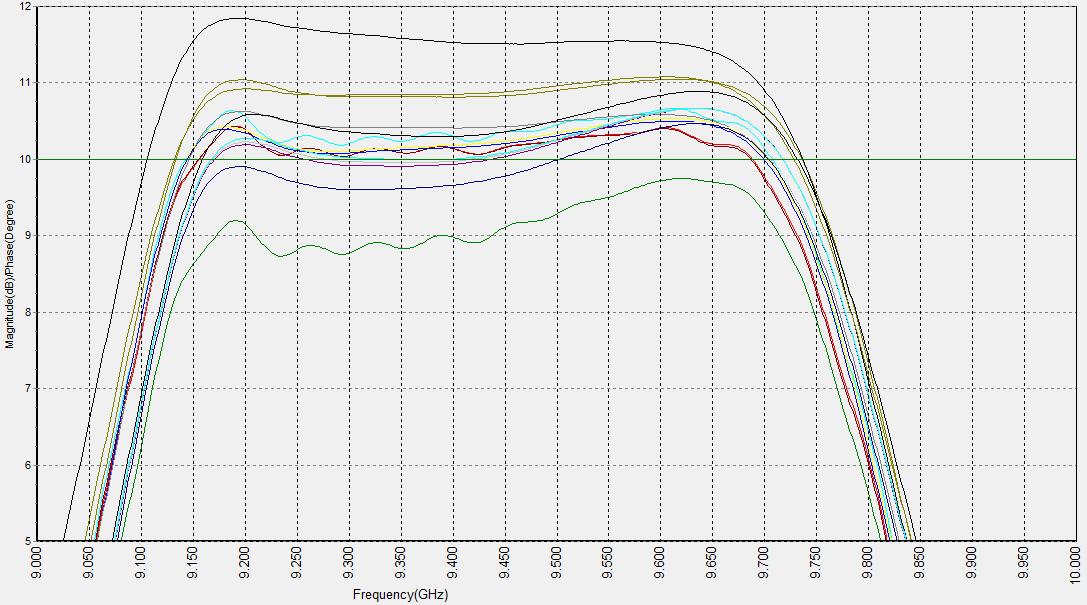
Then there are the occasional intermittent failures, which are by far the hardest to track down and diagnose. These failures typically require that the same unit be tested multiple times to capture the failure. With that known, your analysis tool should have the ability to overlay the tests for the same module for each discrete run. That way a DUT can be tested repeatedly and each run can be saved and available for review. The failures are common for changes in a mechanical connection or can be temperature dependent.
Intermittent Failures (Single unit with repeated test)
Good data and the proper analysis tools are worth their weight in gold when it comes to improving RF manufacturing and test.You’ll earn your investment back multiple times by not duplicating test, impacting production testing or pulling in additional resources when (not if) something fail on the line.And here’s the kicker — by putting the right tools in place this can all be done remotely from the comfort of your desk. Talk about progress.