

Have you ever had trouble with EMI?
You’ve tried different fixes over and over again knowing full well that your solutions teetered on the threshold unrealistic to manufacture or faced EMI remediation costs that exceeded the price of the device under test!
Then there is the human element. Let’s face it, you only have 10 fingers so it’s quite painful to ship one with every product.
I once heard a wise EMI guru (Scott Roleson/HP) describe the most practical way to solve for EMI – the so called soup can analogy originally discussed in 1992.* Needless to say, EMI problems have been around a while. I’m convinced this approach in many cases can provide the lowest cost compliant solution in the shortest amount of time for EMI debug.
Challenge:
Imagine you have a soup can with 20 dimples in it. Three of these dimples are punctured through so they will leak when filledwith liquid (EMI). You are blindfolded so you can’t see which dimples are punctured much like you are blindfolded while solving EMI problems. You have patches to fix the leaks, but each patch costs $10. Solve for $30 in the shortest amount of time.
Answer:
The solution is quite simple. You start with $200 (20 patches) and place a patch on every dimple that you can feel. You fill the can up with water, and remove the patches one at a time until you feel a leak. You are left with three patches on the can.
EMI debugging can be very similar. You often need to solve problems in the right order and there can be multiple emission sources masked by complementary culprits.
Take the example shown in the figure below. In this example, a real-time spectrum analyzer with a DPX display shows a spread spectrum emission. Two tonal emissions underneath the peak of this signal are circled. A quasi-peak (QP) detector used for compliance testing will give you a resultant value that is somewhere between the Average (light blue trace) and Peak (yellow trace).
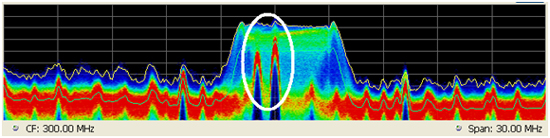
To find the maximum emission would be quite a challenge. Since the bandwidth of the QP detector is significantly less than the bandwidth of the emission, you would need to choose the right location in the spread spectrum signal to even measure the contribution of the highest tonal emission. Adding to the complexity, when you try to maximum the azimuth or antenna height of the antenna during the test the relative values of these emissions will change.
EMI testing can be less painful when you start by suppressing all emissions you can find. Get a comfortable margin for test, then one by one remove those patches and look for the leaks.
* Roleson, Scott, "The 'Kill it Dead" Strategy," EMC Test & Design, Vol. 3, No. 5, September/October 1992, p. 76.