
An integrated and highly-automated method of pulsed-RF signal measurement employs a computer as the central controller and user console to perform both scalar and vector measurements of RF signals. It also uses peripheral RF instruments, such as a vector network analyzer, signal generator and spectrum analyzer as building blocks. Matlab® codes are developed for instrument control, measurement execution and data visualization. A graphical user interface (GUI) facilitates the monitoring and control of measurement processes as well as the display of test results.
A pulsed-RF signal is often employed in a radar or communication system with a time division multiple access (TDMA) or time-division duplexing (TDD) protocol. Typically the input and output signal to a high-power RF device is not designed to work in a continuous wave (CW) mode, so its characteristics must be measured while operating in a pulsed mode. This requires an attenuator to reduce a large signal to an acceptable level for laboratory instruments and a means for creating and capturing the RF pulses. A synchronized trigger is also needed to control the pulses. The trigger signal enables and disables a device under test (DUT) and allows a receiver to synchronously capture the incoming pulsed waveform.
Figure 1 Timing diagram of signals in RF pulse creation.
Along with auxiliary power suppliers, several instruments must work together to provide the proper signal environment. This is typically built around a central instrument, often a vector network analyzer (VNA)1 or a nonlinear vector network analyzer (NVNA).2 For this type of system each instrument is set with the precise state and working mode to function properly as a whole for a dedicated measurement.
Figure 2 Architecture of the test platform.
This article describes a more flexible approach in which a computer acts as the central coordinator with the test scheme, instrument state setting, test execution, measurement retrieval, data processing and visualization of results planned in a test script. The test script, employing several reusable routines, is stored in the computer and executed through a graphical user interface (GUI). Execution of the test script calls the right routines in the proper order.
This computer centric method retains the original functionality of the measurement system while adding some new features. First, the states of all instruments are recorded and set by the software, instead of through manual operations. This greatly reduces human error. Second, integration and programming offers the flexibility to readily perform multiple test tasks. Selected instruments from the system can be easily grouped and programmed to perform specific measurements in a reliable and traceable way. Third, the measurement data is seamlessly managed by the computer. Routine tasks such as data storage and management, data processing and visualization and report generation are performed instantly once the measurement is complete. Data review and measurement re-examination are straightforward. Moreover, the GUI interface provides ease of use for operators, while providing instrument setting transparency.
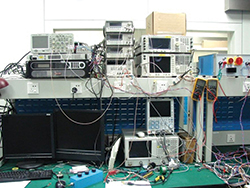
Figure 3 Pulsed RF test platform in the lab.
OPERATION
Pulse Creation
The pulsed RF signal and trigger signal are created with three waveform generators in most scenarios (see Figure 1). Keysight Technologies’ 33250A and 33220A arbitrary waveform generators are often employed. The first waveform, the pilot signal for the rest, is a continuous stream of rectangular pulses with a pulse repetition time (PRT) equal to that of the pulsed RF signal. The pilot signal triggers two other waveform generators, each of them producing one rectangular pulse for every trigger but with an added delay, τ1 or τ2. Waveform 2 triggers a receiver or enables the DUT. Waveform 3 modulates an RF carrier to produce the desired pulsed RF signal. Precise control of τ1 and τ2 locks the pulses to each other in time.
Infrastructure and Connections
In addition to the signal source and receiver, a PC or laptop acts as the central controller, user’s console and data station. All surrounding instruments and peripheral devices, such as RF switches, are connected to the computer via general-purpose interface bus (GPIB), USB, LAN or RS-232 cables. Often a USB-GPIB adaptor or a PCI-GPIB adaptor is required to enable GPIB communication. Communication between the computer and instruments is bidirectional, which is based upon the Standard Commands for Programmable Instruments (SCPI) language. The development environment is Matlab® through its Instrument Control Toolbox™.
Figure 4 Gain linearity and differential gain linearity.
Figure 2 shows the system architecture. The operating system (OS), the Matlab environment with GPIB drivers and the computer-to-instrument interfaces constitute the software infrastructure of the measurement platform. The computer also contains measurement software for Keysight’s 89601 vector signal analyzer (VSA). The computer checks the instrument states and sets working modes. These are programmed in the test script beforehand to accomplish a specific measurement objective. Measurement is initiated by a user’s click of a GUI button. The ordered SCPI instructions are sent to related instruments and raw data is automatically sent back to the computer. A graphic representation of the final test result is then displayed.
A Keysight E4438C signal generator and E4440A spectrum analyzer are the source and the receiver in a scalar configuration (see Figure 3). With the addition of a Keysight 89601 VSA, a quasi-vector measurement may be performed. Other instruments include a Keysight E8357A vector network analyzer to measure scattering parameters in pulsed mode, several Keysight 33250A and 33220A arbitrary waveform generators to provide the pulse modulation and triggering signals, and GUI controllable power supplies.
FEATURE ILLUSTRATIONS
The use of a computer as a central coordinator brings new features to the measurement system and gives users more freedom to design a custom measurement capability. The following are a few examples:
Figure 5 Phase linearity and differential phase linearity.
Real-Time Measurement of Linearity
Differential linearity is a measure of gain variation as a function of input signal. It is defined by two measures: the change in the magnitude of gain with respect to input power, i.e., ǝG/ǝPin, and its change in phase with respect to input power, i.e., ǝΦ/ǝPin. These differential quantities, though not normally available in the set of an instrument’s standard test features, are important for troubleshooting a high power pulsed RF amplifier. The computer-driven method offers the capability to measure and display the differential gain linearity and the differential phase linearity in real time (see Figures 4 and 5). The corresponding gain linearity and phase linearity are also displayed.
ǝG/ǝPin and ǝΦ/ǝPin are calculated from two data sources. One is the presumably stable input signal measured beforehand by the signal generator directly. The other is the output of DUT, measured by the VSA for every pulse. Each time a pulse is captured, the displays shown in Figures 4 and 5 are refreshed with the latest data.
The specific requirement on ǝG/ǝPin and ǝΦ/ǝPin are displayed as red dashed lines. Thus, a user has real-time feedback while fine tuning. The traces of ǝG/ǝPin and ǝΦ/ǝPin are calculated directly from measurement and therefore contain considerable noise. A moving average with a reasonable window size will improve the display.
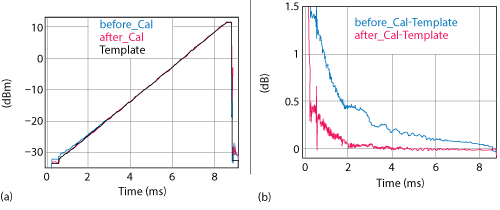
Figure 6 Linearity correction on an arbitrary waveform; waveform before and after calibration (a) error relative to the original waveform template (b).
Figure 7 Amplifier harmonic products. The fundamental frequency is 63.87 MHz.
On the Spot Self-Calibration
An aged signal generator is often nonlinear at the lower power levels of its arbitrary waveform output. This can be observed using a receiver, such as the E4440A. The waveform of the signal generator is measured using the receiver and compared with its IQ template. The error information is used to create a modified IQ template used to generate a new, linearized, arbitrary waveform. All steps are carried out in a rapid, straightforward manner through the GUI (see Figure 6).
Figure 6a displays one pulse in a chain of sawtooth pulses created by the desired template and one by the modified template. Deviation is apparent at lowest power level. Figure 6b displays the error in dB of these two pulses relative to the original sawtooth template. The modified (pre-distorted) template reduces the error to less than 0.1 dB over a larger dynamic range of approximately 37 dB.
Automatic Harmonic Scan
Traditionally, there are two ways to measure the harmonic products of a distorted carrier signal. One is to display the signal spectrum over a wide frequency span, wide enough to show all harmonic products of interest. However, the spectrum resolution and sweep time cannot be optimized simultaneously for a pulsed measurement using this method. The second method employs a built-in spectrum analyzer application controlled by the computer.3
The spectrum analyzer first scans a relatively narrow frequency range centered at the fundamental, which is captured and stored by the computer. Then, it acquires the second order harmonic, which is similarly captured and stored. The spectra at higher order harmonics are successively scanned and stored in the same manner until the highest order harmonic of interest is measured.
Figure 7 displays the harmonic products, up to the seventh order, in the output signal of an amplifier. Each color represents a segment of the spectrum, centered at each harmonic, measured over the span of 10 MHz. Since only 1/40 of the entire spectrum from the fundamental up to the seventh harmonic is scanned, considerable time is saved; this would be impossible if pulses with short duration were measured over a long sweep time. This type of harmonic measurement can also be conducted in the time domain. Figure 8 demonstrates the harmonic measurement with the frequency span of the spectrum analyzer set to zero.
Figure 8 Amplifier harmonic products displayed in the time domain.
Pulsed S-Parameter Measurement With an Ordinary VNA
A dedicated NVNA is normally required for this task,2 because the available E8357A VNA does not have an internal pulse generator. The pulsed mode of this VNA, however, can be still be used with computer control. Waveform 3 in Figure 1 modulates the VNA’s internal source through the AM port on its rear panel, while Waveform 2 triggers the VNA’s internal receiver, but with a narrow pulse width. The modulation signal (Waveform 3) may be omitted if the DUT can tolerate a continuous wave input.
If the frequency span is set to zero on the VNA, the arrival of the receive trigger signal (Waveform 2) is ahead of the transmit modulation signal (Waveform 3), and the sweep time of the VNA is set to be longer than the pulse width, then the VNA will scan the S-parameter over the entire pulse duration and display it in the time domain. Strong noise is usually found in the S-parameter measurement before the arrival of a pulse and after the fall of a pulse. This is also called a “pulse profile” measurement.4
If the VNA is set to measure one point for each trigger and the receive trigger arrives when the RF pulse is on, the VNA will scan the S-parameter while hopping from one frequency point to another. This VNA mode brings the measured S-parameter into the frequency domain. This is also described as the “point-in-pulse” measurement.4 In order to implement this mode, pulse delay τ1 or τ2 must be adjusted to locate the narrow width of Waveform 2 within the pulse width of Waveform 3.
Figure 9 shows the measurement of S11 (magnitude and phase) in the frequency domain at the input port of a broadband CW amplifier with three signal formats. One format is the conventional CW signal. Another one is the “point-in-pulse” measurement with a pulsed RF transmit signal and triggered measurement. The last one is a CW RF transmit signal and triggered measurement. The difference in S11 due to having different signal formats is small.
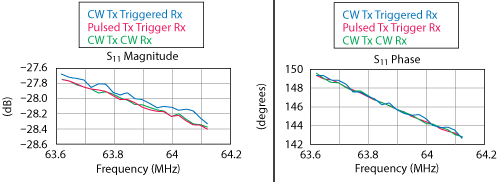
Figure 9 S11 measurement of one device with several signal formats.
Figure 10 Timing diagram for pulse burst creation.
Continuous Capture and Stability Measurement
An RF pulsed waveform is usually transmitted as a sequence of bursts with every burst containing a few pulses. Using the computer controlled measurement method, the sequence of bursts is created by adding one more waveform generator to the architecture of Figure 1 (see Figure 10). The added waveform generator creates a pulse sequence called a burst trigger. The original pulse pilot signal of Figure 1 is now triggered by the burst trigger and a limited number of pilot signals, N, are generated after each burst trigger. The instrument diagram for this measurement is shown in Figure 11. The E8357A VNA measures S21 in time domain and sends the data back through the GPIB continuously, under control of the central computer. Note that transmitter modulation is not used in the diagram of Figure 11.
When pulse capture is complete, a data processing routine compares and analyzes all the pulses and displays the results as desired. Figure 12 provides a 3D view of the S21 measurement on the pulse bursts. The pulses in different bursts are aligned to have the same start time in different frames. Both the magnitude and phase of S21 are displayed in the left and right frames, respectively. Each colored trace represents a captured pulse. Noise appears when a pulse is off.
Figure 11 Instrument diagram of a vector measurement with pulse bursts.
Conclusion
The computer centric measurement brings many advantages to the characterization of pulsed high power RF devices. First, it minimizes operator dependent measurement errors. The combination of appropriate instrument states and working modes of selected instruments are saved and recalled by the computer precisely and in an orderly manner for each specific measurement. Second, the programming and execution mechanism makes the measurement system flexible for multi-purpose tests with a subgroup of instruments. Third, the GUI hides the complex programming and instrument interrelationships while providing the user with the convenience of a reliable one-click operation. For the measurement designer, on the other hand, the test script is transparent and readily accessible. The potential conflict of GUI operation is avoided by software interlock. Last, but not at least, it offers the freedom to perform data processing on a measurement. The codes for data visualization are separate from the raw data obtained from instruments. A user has the flexibility to revisit the data and express the results from various perspectives. The powerful data visualization codes can provide new measurement features, even beyond those of existing instruments.
References
- C. Arnaud, D. Basataud, J. Nebus, J. P. Teyssier, J. P. Villotte and D. Floriot “An Active Pulsed RF and Pulsed DC Load–Pull System for the Characterization of HBT Power Amplifiers Used in Coherent Radar and Communication Systems,” IEEE Transactions on Microwave Theory and Techniques, Vol. 48, No. 12, December 2000, pp. 2625–2629.
- T. S. Nielsen, C. Gillease and V. Torres, “Practical Considerations for High-Power X-Parameter Measurements for Power Amplifier Design,” IEEE 13th Annual Wireless and Microwave Technology Conference, April 2012, pp. 1–9.
- “Measurement Guide & Programming Examples – PSA and ESA Series Spectrum Analyzers,” November 18, 2014,http://cp.literature.agilent.com/litweb/pdf/E4401-90482.pdf.
- “Pulsed-RF S-Parameter Measurements Using Wideband and Narrowband Detection,” Application Note 1408-12, November 18, 2014, http://cp.literature.agilent.com/litweb/pdf/5989-4839EN.pdf.
Yong Liu received his bachelor’s and Ph.D. degrees from Southeast University in 1997 and 2004. He is currently working with Philips Research, China. His research interests include antenna design for handsets, bio-radio channel modeling for healthcare, quality control for LED lighting and RF transmit/receive signal chain design for MRI.
Figure 12 Measurement of S21 on bursts of pulses.