Free-space vs. One-horn Interferometer Techniques for Radar Absorber Measurements
The reflection coefficient measurements of radar-absorbing materials (RAM) in free space (FS) and using the one-horn interferometer (OHI) technique are compared for different test samples. It is observed that the problems in the measurement of reflection coefficients using the OHI technique can be eliminated and better accuracy can be achieved by using spot-focused horn antennas in FS. Because of its contactless nature the FS system can be adapted conveniently to quality control during the absorber manufacturing process.
K.A. Jose, Vasundara V. Varadan and Vijay K. Varadan
Pennsylvania State University, Center for the Engineering of Electronic and Acoustic Materials
University Park, PA
RAMs have attracted considerable interest in recent years since they are used in many military and civilian applications. The study of electromagnetic and physical properties of materials as well as the techniques for determining the reflection coefficient of RAMs at microwave frequencies are essential for industrial applications. The measurement and evaluation of RAMs are difficult and time-consuming tasks. A large number of papers describing the accurate determination of the reflectivity of RAMs have been published. The measurements are either of the destructive type (as in waveguide or coax measurements where the sample is cut properly to fit into the fixtures) or the nondestructive type (as in the Naval Research Laboratories’ arch, FS or large waveguide methods).1,2
Recently, a swept-frequency OHI was described where the absorber panel is placed against the aperture of a well-matched horn.3 This aperture-matched exponential horn technique offers a reflectivity level lower than –35 dB and has the advantage of using fairly small areas (approximately the size of the horn aperture) of absorbers. However, the metal-backed planar absorbers are placed directly against the aperture of the horn. When the horn’s reflectivity is compared to that of a metallic shorting plate, the thickness of the absorber may affect the accuracy of the measurement. Because the sample is sandwiched between the horn aperture and the shorting metallic plate, various thicknesses of the sample may place the metallic plate at different positions. In such cases, distinguishing the performance of the absorbers from variation of the thickness and variation of the relative position of the shorting plate is a problem. The final product from the industry usually is in a planar form and may have inherent inhomogeneities from point to point in a single sample. Hence, the OHI technique may show variations in performance.
In this article, a simple spot-focused, one-horn FS measurement technique for the accurate characterization of planar absorbers is described. This nondestructive and contactless setup is for measuring the reflectivity of samples and makes it possible to measure electromagnetic properties for various temperatures. Using spot-focused antennas, the FS method provides plane-wave illumination and does not require samples to meet strict size and shape tolerances. Since the focused antennas use waveguide feeds and transitions, they can discriminate the polarization state of the received signal, which is transmitted through or reflected from the sample. Because of the contactless nature of the system, it can be adapted conveniently to quality control during the manufacturing process in a variety of industrial settings.
Measurement Setup
A schematic diagram of the experimental setup is shown in Figure 1 . 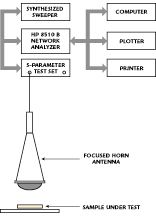 The system described here has an automated setup for measuring the reflection coefficient as well as the complex permittivity and permeability of samples at different temperatures.4–6 The spot-focusing horn lens antenna consists of two equal plano-convex dielectric lenses mounted back to back in a conical horn antenna. The antenna has a focal length of 30.45 cm and a focal depth of 8.4 wavelengths at 10 GHz. Because of the spot focusing of the lens antenna, diffraction effects at the edge of the sample are negligible.
The antenna is connected to an S-parameter test set using circular-to-rectangular waveguide adapters, rectangular-to-coaxial line adapters and precision cables. Two pairs of focused antennas are required to cover the 8 to 40 GHz frequency range. The sample for reflectivity measurement is placed directly below the antenna at its focal plane. The vector network analyzer is calibrated using a FS thru-reflect-line calibration technique and time domain gating eliminates multiple reflections.7 The reflection coefficients are measured in a step-sweep mode and a computer is used for data acquisition, storage and processing.
Figure 2 shows the conventional OHI technique where the absorber is located 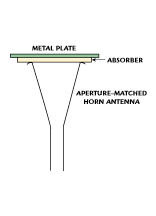 between the horn aperture and shorting metallic plate. One of the major problems here is that the distance between the horn and shorting plate (plane of calibration) changes for different thicknesses of the absorbers and each time separate calibration of the system is required. In actual industrial applications, calibrating the measuring system for each individual measurement is not practical. Figure 3 shows the time
 domain response from a shorted metallic plate for different positions in the OHI technique. It is evident from the data that the accuracy of the measurement is affected by the movement of the shorting metallic plate for different thicknesses of the sample. Since a two-way propagation time is required for the signal to travel from antenna to metallic plate and back, marker 1 is located at 28.28 mm, which is twice the distance to the first shorting plate.
Since the absorber is located in the far field of the horn antenna and the position of the metallic plate is fixed, the thickness of the absorber does not affect the accuracy of the measurement in the FS method. It is possible to separate the reflections from various parts of the test setup using the time domain features of the vector network analyzer because of the finite difference between their arrival times. The time domain method for measuring the reflection of the coefficient is used widely.8 The diffraction effects at the edges of the sample are usually negligible if the transverse dimension of the sample is greater than three-times the 3 dB E-plane beam width of the antenna at the focus.7 For the described antenna, the measured 3 dB beam width in the E- and H-planes is 2.87 and 2.03 cm, respectively, at 14.5 GHz. Generally, the 3, 10 and 20 dB E-plane beam widths of the antenna are approximately l0 , 1.9l0 and 3.8l0 , respectively.
Experimental Results
Samples were characterized using both methods to compare the performances 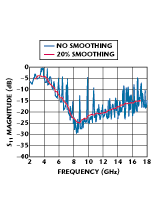 of the OHI and FS techniques. A wideband (2 to 18 GHz) aperture-matched horn antenna3 is connected to the S-parameter setup and OHI measurements are taken using this antenna. The antenna is calibrated for isolation and response using a shorting metallic plate. The metal-backed sample is placed so it touches the aperture of the horn and S11 is measured. Figure 4 shows the measured S11 response from a metal-backed type AN-73 absorber. Inserting the sample between the shorting plate (plane of calibration) and aperture causes the calibration plane to change. It would be possible to analyze the data only if they are properly curve fitted.
The data are presented with and without smoothing using a special feature of the vector network analyzer. However, this smoothing depends on the compromise between the accuracy and individual frequency points of interest. In critical cases such as narrowband absorbers, the trade-off may cause loss of measured data. 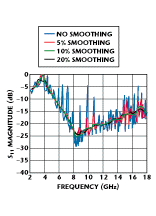 The smoothing operation in a network analyzer operates in the same manner as a video filter operator. Smoothing produces a linear average of adjacent data points. In a typical case of 20 percent smoothing, data are smoothed over a 3.2 GHz frequency smoothing aperture and the average value of the data over a 3.2 GHz frequency aperture is displayed. In this case, it is necessary to select a low value for smoothing for narrowband absorbers. Figure 5 shows the measured S11 response for different smoothing values applied using the network analyzer. Cases 1, 2 and 3 are for five percent (0.9 GHz span), 10 percent (1.8 GHz span) and 20 percent (3.2 GHz span), respectively, of smoothing.
Since the calibration plane moves with the thickness of the sample, the measured performance changes. Figure 6 shows the reflectivity of the AN-73 absorber of 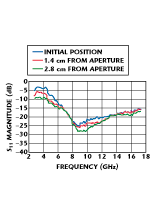 the same thickness but different aperture-sample gaps. In position 1, the sample is placed directly touching the aperture of the horn antenna and the value of S11 measured at 9.68 GHz is –21.40 dB. The absorber is moved back along with the metallic plate for a distance of 2.8 cm from the aperture and the measurements are repeated. It is determined that the S11 is changed to –26.84 dB for the same frequency. From such observations it is not easy to conclude the performance of the sample.
The FS measurement technique does not lead to such problems since the sample is located in the far field of the antenna and has a fixed calibration plane. Moreover, the smoothing problem does not occur because of an accurate calibration and error correction. It is also observed that the accuracy increases by using the time domain gating features of the network 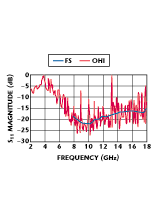 analyzer.
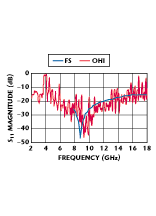
In order to verify the accuracy of the measurement setup, performances of various microwave absorbers were measured and compared. Figure 7 shows the comparison of the measured data from the AN-73 absorber using the FS and OHI techniques for 8 to 18 GHz. For FS measurements, it is necessary to use two antennas to cover the entire frequency band from 8 to 40 GHz; one antenna is for 8 to 12 GHz and the other is for 12 to 40 GHz.
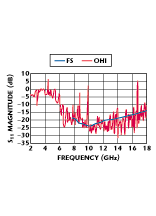
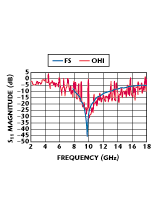 Figure 8 shows the magnitude of S11 for metal-backed ferrite absorbers using FS and OHI techniques. The resonance absorption is predominant at approximately 8.5 GHz since the thickness of the composite ferrite absorber is 3 mm. Figures 9 and 10 show the performance comparison of FS and OHI measurements for a composite radar absorber. These absorbers are designed and developed for specific applications to be used as RAMs. It can be seen from the above observations that the FS technique offers better results compared to the OHI technique.
Conclusion
The results reported in this article indicate that better accuracy in the measurement of reflection coefficients of RAMs is obtained with the FS spot-focused measurement technique compared to the near-field OHI technique. It also has been observed that accuracy is improved by using the time domain gating features of the network analyzer. (It is not possible to use the time domain gating features in the OHI technique.) One of the major advantages of the FS system is its contactless nature, which allows it to be adapted conveniently to quality control during the manufacturing process. Using a wideband (2 to 18 GHz) aperture-matched, spot-focused horn, it is possible to obtain results for the entire frequency band without changing the horn antennas. Work in this area is ongoing.
References
- E.F. Knott, J.F. Shaffer and M.T. Tuely, Radar Cross Section, Chapters 8 and 9, Artech House, 1993.
- E. Michielssen, J.M. Sajer, S. Ranjithan and R. Mittra, "Design of Lightweight, Broadband Microwave Absorbers Using Genetic Algorithms," IEEE Transactions on Microwave Theory and Techniques, Vol. 41, July 1993, pp. 1024–1030.
- D.E. Baker and C.A. van der Neut, "Reflection Measurements of Microwave Absorbers," Microwave Journal, Vol. 31, No. 12, December 1988, pp. 95–104.
- D.K. Ghodgaonkar, V.V. Varadan and V.K. Varadan, "Free-space Measurement of Complex Permeability of Magnetic Materials at Microwave Frequencies," IEEE Transactions on Instrumentation and Measurements, Vol. 39, April 1990,pp. 387–394.
- M.H. Umari, D.K. Ghodgaonkar, V.V. Varadan and V.K. Varadan, "A Free-space Bistatic Calibration Technique for the Measurement of Parallel and Perpendicular Reflection Coefficients of Planar Samples," IEEE Transactions on Instrumentation and Measurements, Vol. 40, February 1991, pp. 19–24.
- V.V. Varadan, R.D. Hollinger, D.K. Ghodgaonkar and V.K. Varadan, "Free-space Broadband Measurement of High Temperature, Complex Dielectric Properties at Microwave Frequencies," IEEE Transactions on Instrumentation and Measurements, Vol. 40, October 1991, pp. 842–846.
- D.K. Ghodgaonkar, V.V. Varadan and V.K. Varadan, "Free-space Method for Measurement of Dielectric Constants and Loss Tangent at Microwave Frequencies," IEEE Transactions on Instrumentation and Measurements, Vol. 38, 1989, pp. 789–793.
- A.R. Onderjka and M. Kanda, "A Time Domain Method for Measuring the Reflection Coefficient of Microwave Absorbers at Frequencies below 1 GHz," Proceedings of the IEEE APS International Symposium, 1991, pp. 1656–1659.
K.A. Jose received his PhD degree from Cochin University of Science and Technology in 1989. After serving on the faculty of Cochin University from 1989 to 1993, he joined the Center for the Engineering of Electronic and Acoustic Materials at Pennsylvania State University where he currently is a research associate.
Vasundara V. Varadan received her PhD degree in physics from the University of Illinois in 1974 and has served on the faculties of Cornell University and Ohio State University. Currently, she is an alumni distinguished professor of engineering science and electrical engineering and the co-director of the Penn State Research Center for the Engineering of Electronic and Acoustic Materials. Varadan is also a fellow of the Acoustical Society of America and a member of the IEEE and the Society of Engineering Science.
Vijay K. Varadan received his PhD degree from Northwestern University in 1973. After serving on the faculties of Cornell University from 1974 to 1977 and Ohio State University from 1977 to 1983, he joined Pennsylvania State University where he currently is an alumni distinguished professor of engineering science and electrical engineering and the co-director of the Penn State Research Center for the Engineering of Electronic and Acoustic Materials. Varadan’s interest is in the design and development of various electronic, acoustic and structural composites and devices. He is also interested in microwave and ultrasonic experiments to measure the dielectric, magnetic, mechanical and optical properties of composites.
